
AI Trading Dashboards: What Metrics Matter?
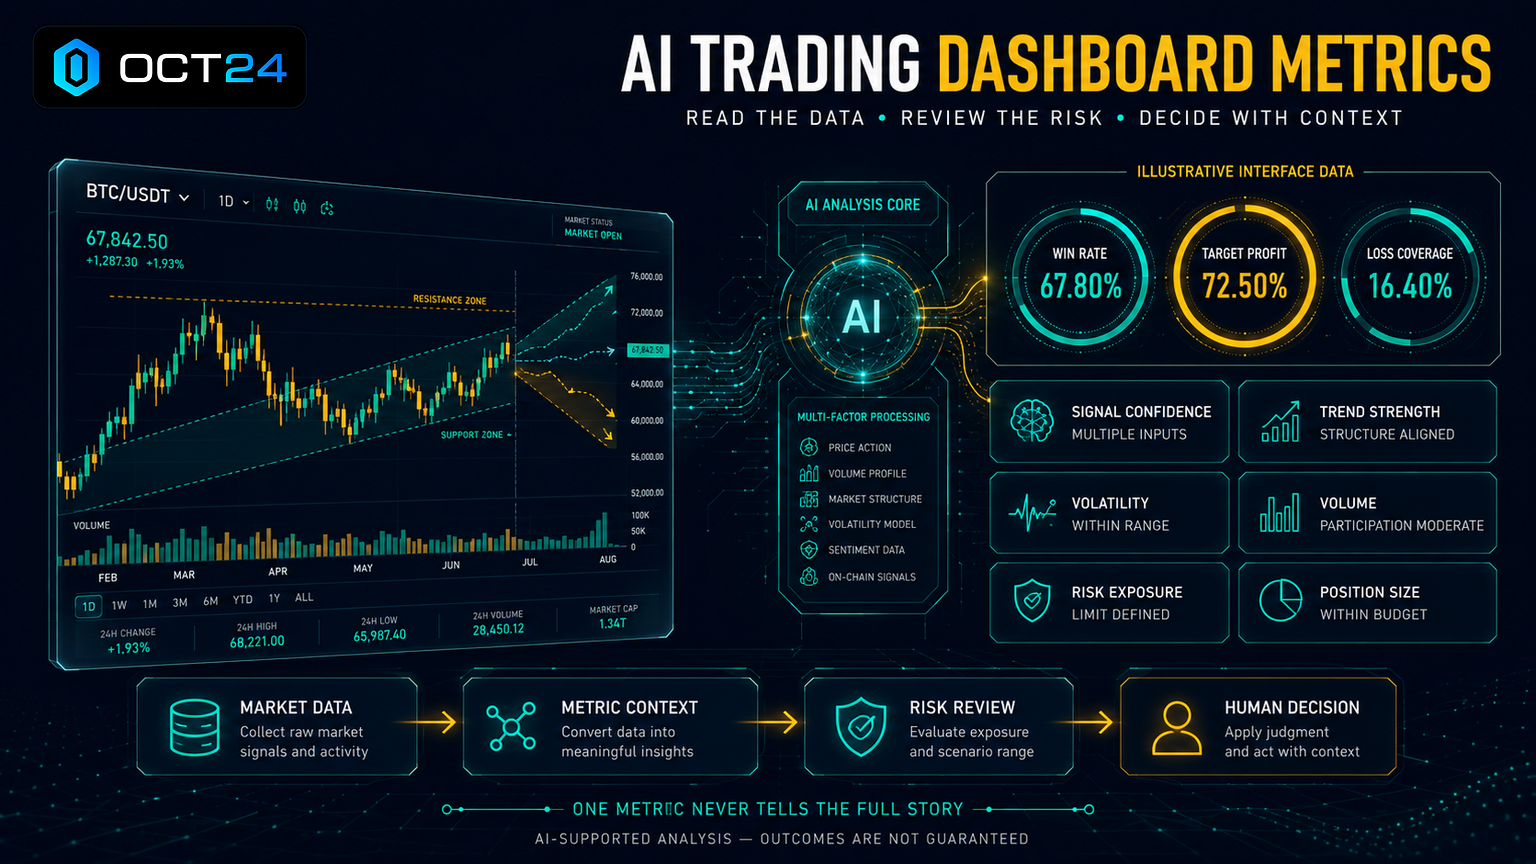
AI trading dashboards help traders review important trading metrics in one place. The most useful dashboard metrics are the ones that make a trading decision clearer, especially Win Rate, Target Profit, and Loss Coverage. These numbers help traders understand probability, potential reward, and possible downside before deciding whether a trade fits their plan.
For beginner and intermediate crypto traders, a good trading dashboard should not feel like a wall of complicated charts. It should help the trader understand what matters quickly, without hiding risk or making the opportunity look risk-free.
OCT24 keeps this process simple. The platform performs most of the market analysis by scanning crypto market conditions, identifying potential opportunities, and presenting AI-supported trading signals. The trader then reviews the available metrics and decides whether to activate the trade.
This article explains which AI trading dashboard metrics matter most, how to read them, and how to avoid making emotional decisions based on one number alone.
What Is an AI Trading Dashboard?
An AI trading dashboard is a screen that helps traders review AI-supported trading information. It may include trading signals, market status, bot metrics, performance history, risk details, and execution options.
The goal is simple: make trading information easier to understand. Instead of forcing the trader to jump between charts, indicators, news, and order screens, a dashboard brings the most useful details into one cleaner view.
In traditional manual trading, the trader may need to build a full market view alone. They may check technical analysis, compare timeframes, read market news, and decide where to enter or exit.
With OCT24, the experience is different. The AI bot handles most of the market scanning and presents simplified trade information. The user does not manually choose the crypto market, and OCT24 does not currently show full asset research, exact entry points, or exact exit points for every opportunity. The main decision information is focused on metrics such as Win Rate, Target Profit, and Loss Coverage.
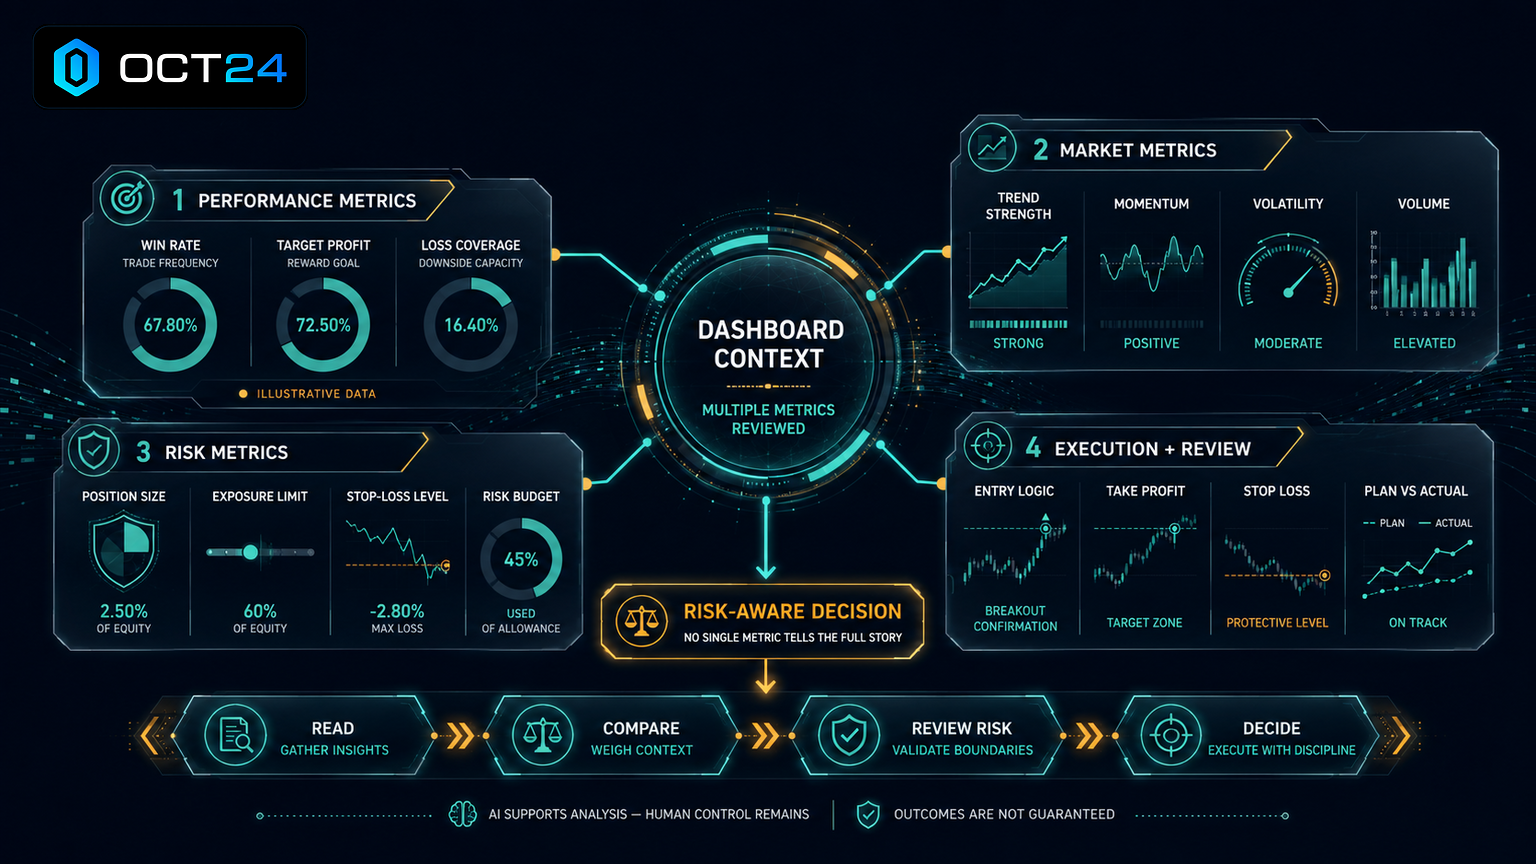
Why AI Trading Dashboard Metrics Matter
AI trading dashboard metrics matter because they turn a fast trading opportunity into something easier to review. Without clear metrics, traders can become distracted by price movement, social media, or fear of missing out.
A strong dashboard helps answer practical questions before the trader acts. Is the signal worth reviewing? Is the possible reward realistic? Is the downside acceptable? Does this trade fit the trader’s account and risk comfort?
Good metrics do not guarantee results. They simply help traders make more informed decisions. This is important because crypto markets can change quickly, and even a strong-looking setup can lose.
For OCT24 users, the key is not to treat dashboard metrics as promises. The better approach is to use them as a structured review process before activating a trade.
The Three Most Important Metrics on OCT24
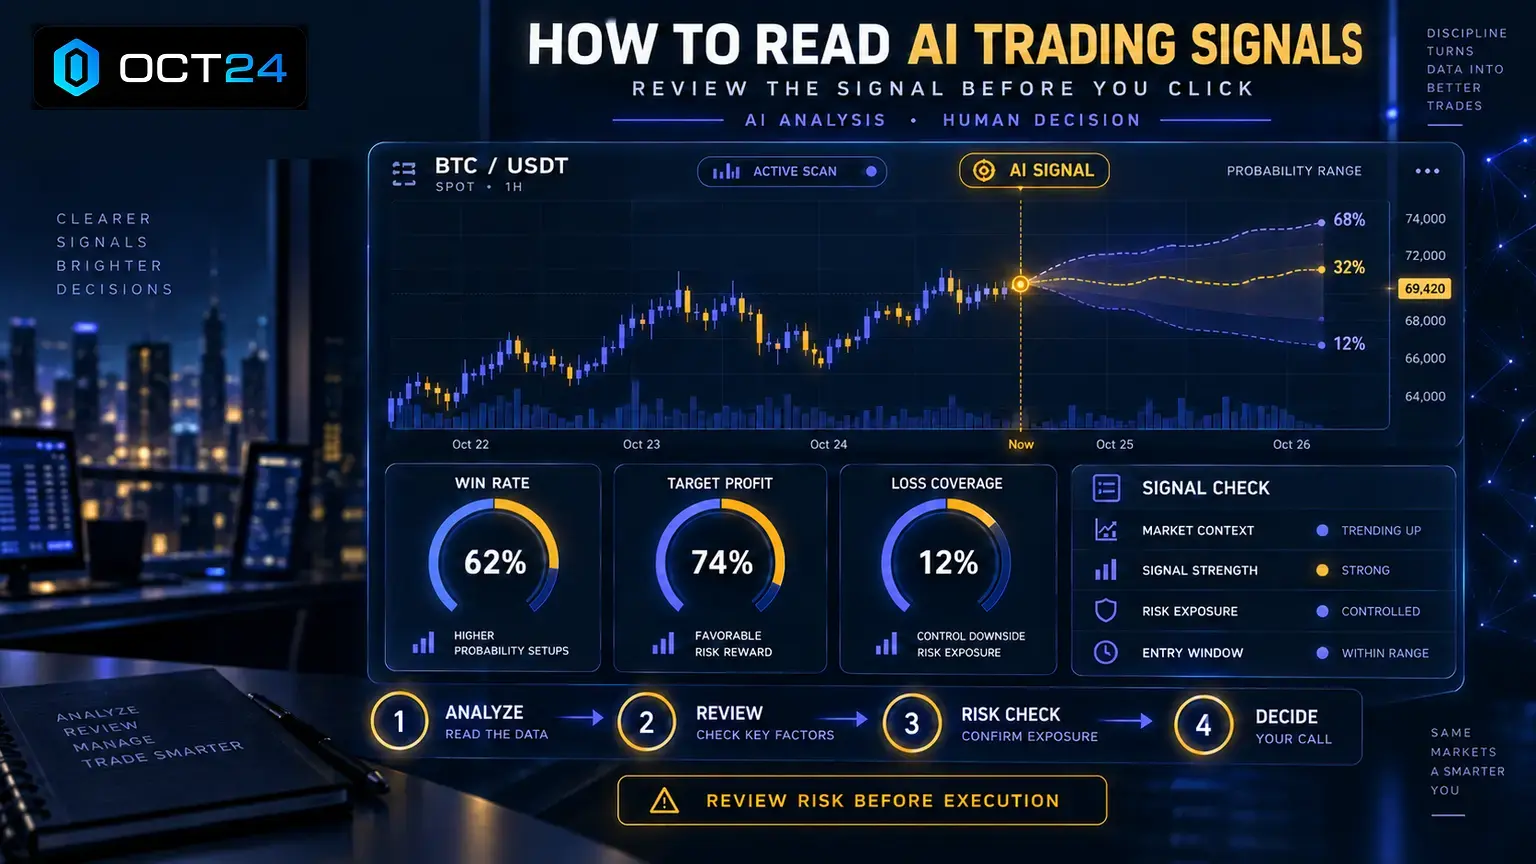
The three most important OCT24 metrics are Win Rate, Target Profit, and Loss Coverage.
Win Rate helps traders understand the probability side of a trade. Target Profit helps traders understand the potential reward. Loss Coverage helps traders think about the possible downside and whether the trade feels suitable for their risk comfort.
These three metrics work best together. A trader should not look only at the highest Target Profit or only at the strongest Win Rate. A more responsible review compares all three before making a decision.
This is where AI trading signals become more useful. A signal is easier to review when the trader has a simple framework for understanding what the dashboard is showing.
Win Rate: What It Shows and What It Does Not Show
Win Rate is one of the first dashboard metrics many traders notice. It is easy to understand because it appears to answer a simple question: how often has this type of setup been successful?
A higher Win Rate can make a trade feel more attractive. But it should never be treated as a guarantee. Win Rate is a probability-based metric, not a promise that the next trade will win.
A trader can use Win Rate more responsibly by comparing it with Target Profit and Loss Coverage. If the Win Rate looks strong but the possible downside feels uncomfortable, the trader may still decide not to activate the trade.
This is an important part of trading bot risk management. The goal is not to find a number that makes risk disappear. The goal is to understand the trade clearly before taking action.
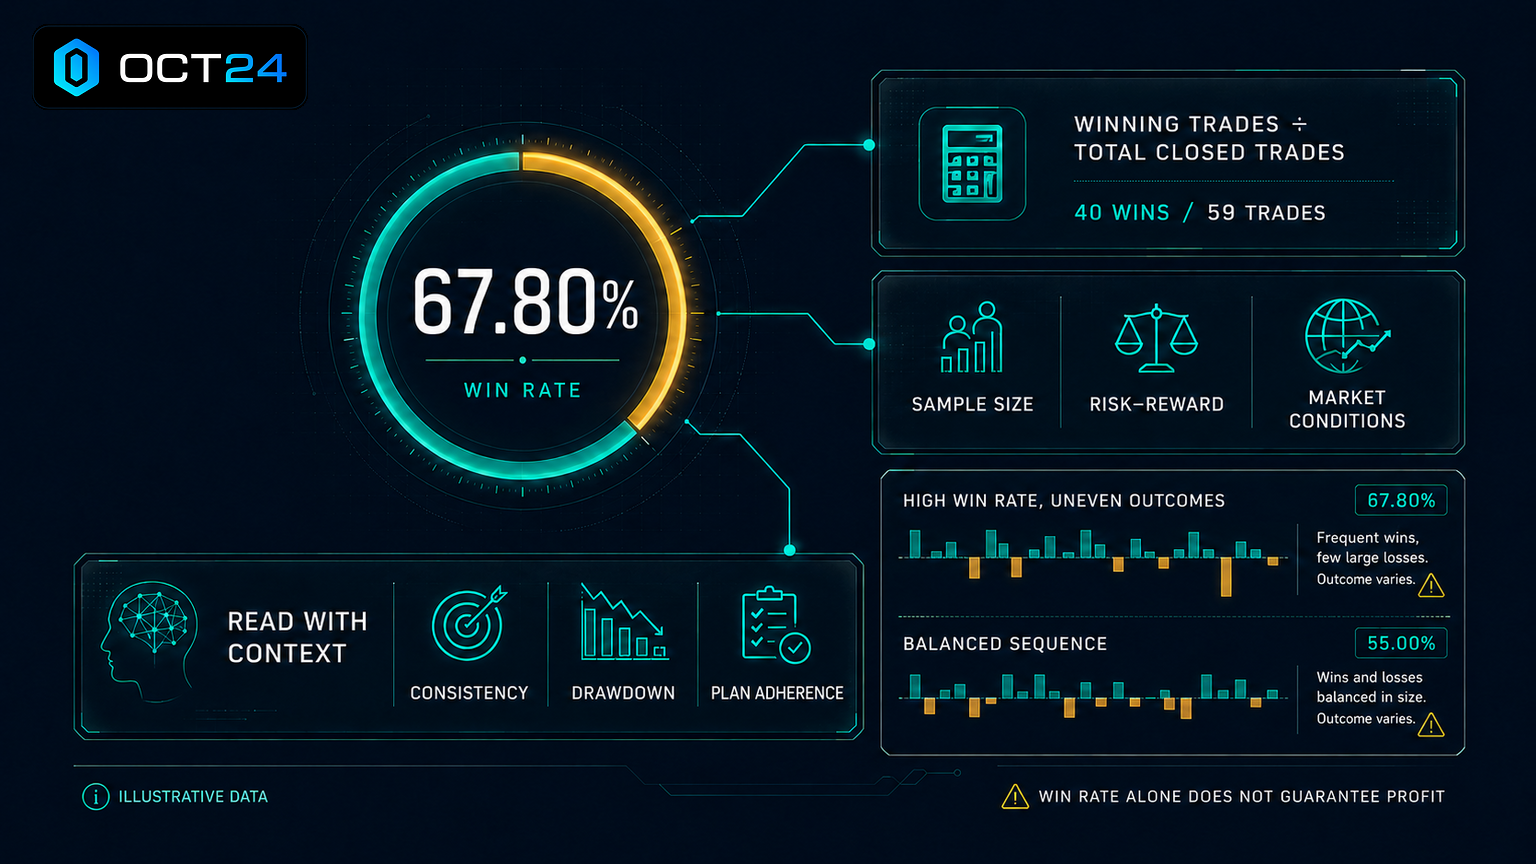
Target Profit: Why Bigger Is Not Always Better
Target Profit shows the potential profit target for the trade or bot cycle. It helps the trader understand the upside that the opportunity is aiming for.
This is useful, but it can also create emotional pressure. A large Target Profit can make a trader feel excited and rush into a decision. That is why Target Profit should always be reviewed with the other dashboard metrics.
A smaller Target Profit with a stronger Win Rate and more comfortable Loss Coverage may fit some traders better than a larger Target Profit with a weaker overall profile.
OCT24 presents Target Profit as part of the simplified signal review process. The trader should use it to understand the possible reward, not as a reason to ignore risk.
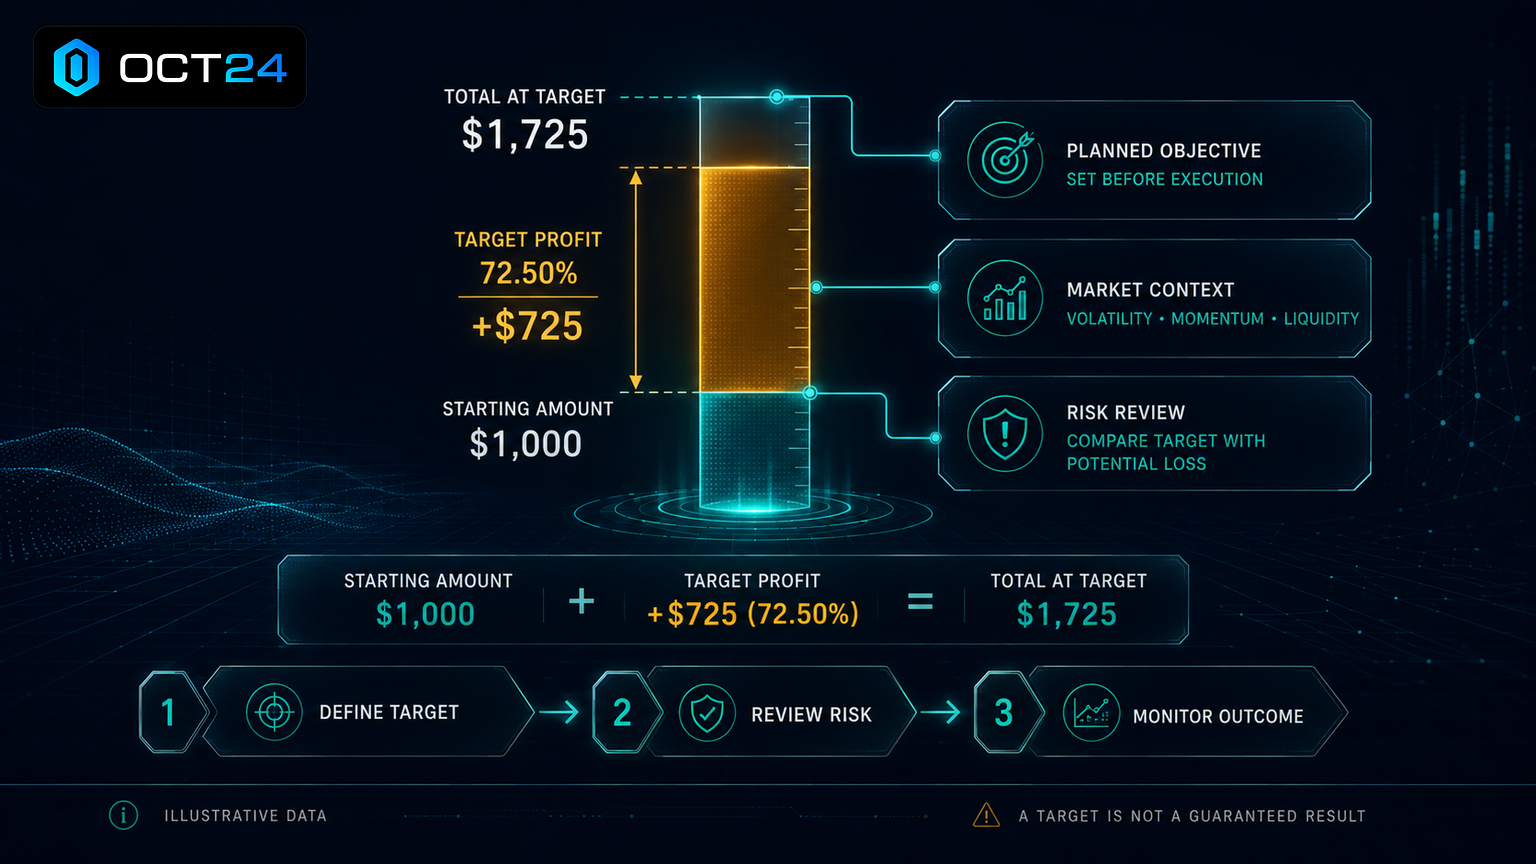
Loss Coverage: The Metric That Keeps Risk Visible
Loss Coverage is one of the most important metrics because it keeps risk visible. Many traders naturally focus on possible profit first, especially when the market is moving quickly.
Loss Coverage helps bring the trader back to the downside. It encourages a more balanced question: if this trade does not work, am I comfortable with the possible loss profile?
This does not mean Loss Coverage removes risk. It does not make the trade safe, guaranteed, or protected from all market movement. Crypto trading still involves uncertainty.
The value of Loss Coverage is that it helps traders pause before activating a trade. That pause can reduce emotional decisions and support better risk awareness.
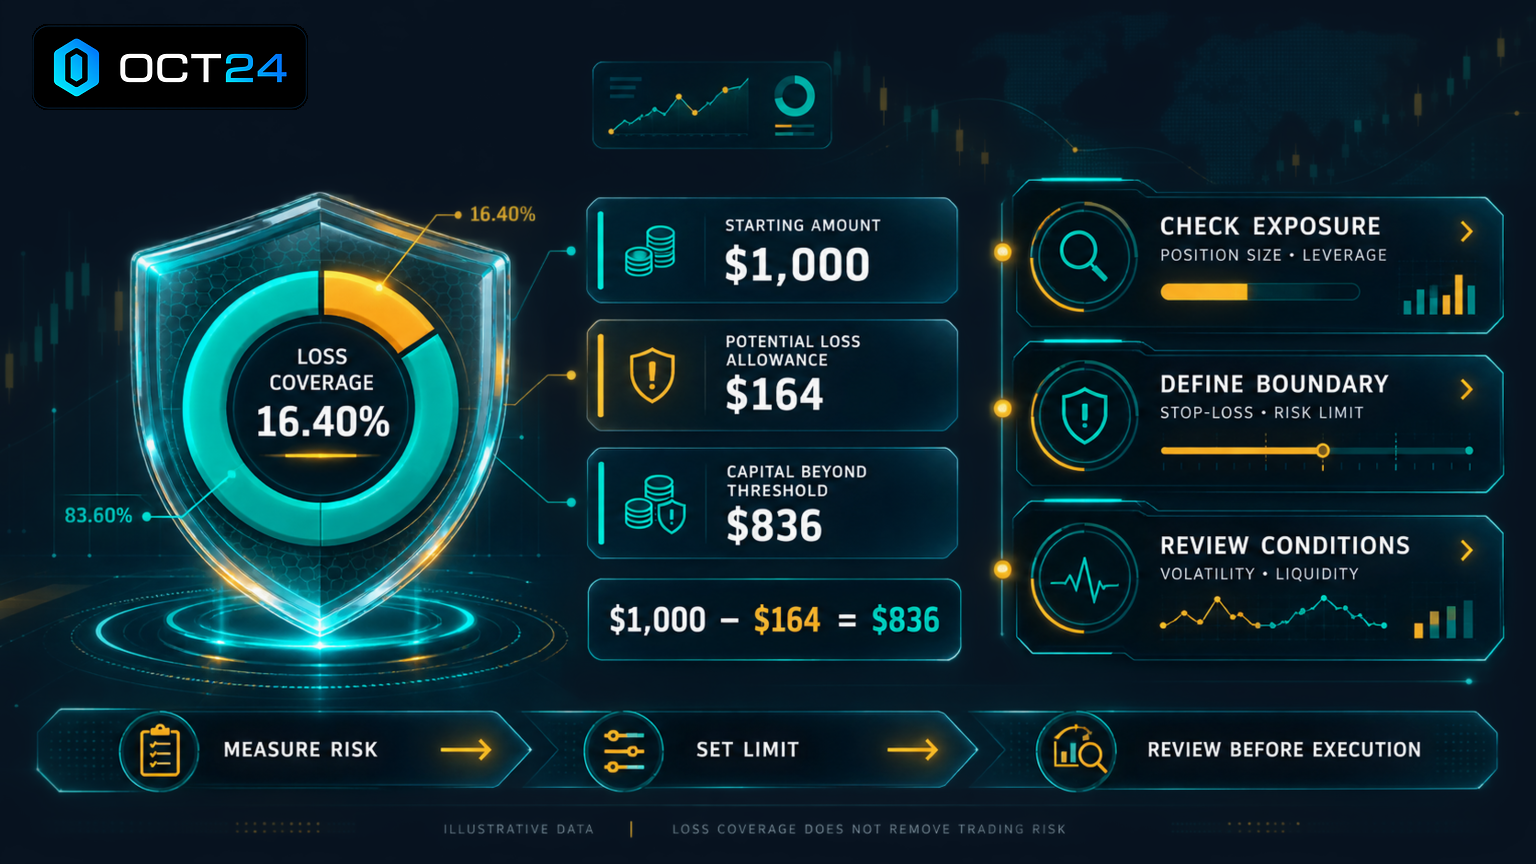
How to Compare Win Rate, Target Profit, and Loss Coverage
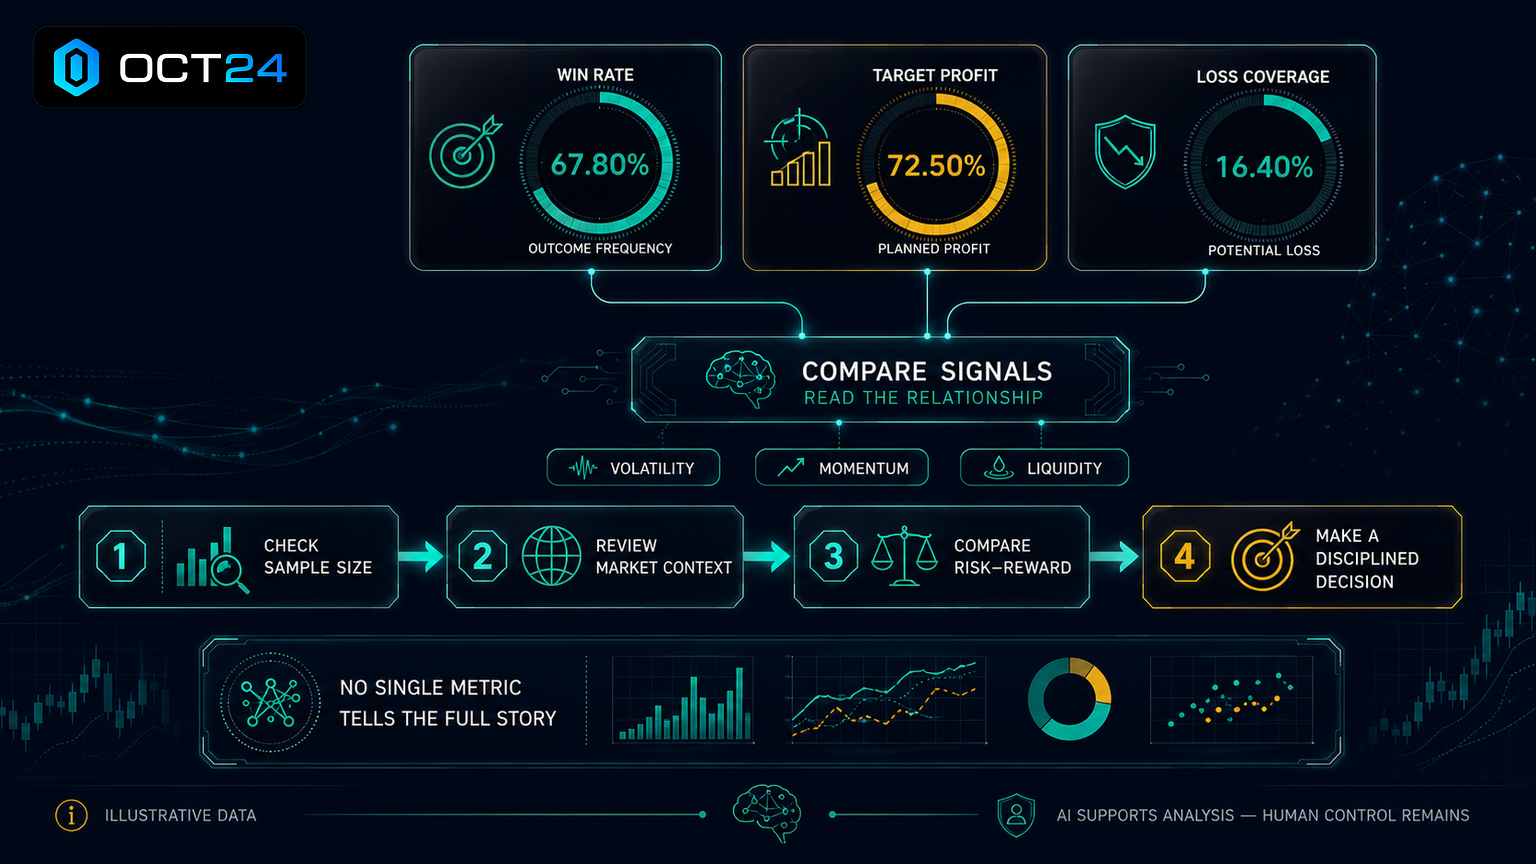
The most useful AI trading dashboard review is not based on one metric. It is based on comparison.
A trader can start by looking at Win Rate. If the Win Rate looks reasonable, the next step is to review Target Profit. After that, the trader should check Loss Coverage and ask whether the possible downside fits their account and mindset.
This simple order helps avoid a common mistake: getting excited by one number and ignoring the rest of the dashboard.
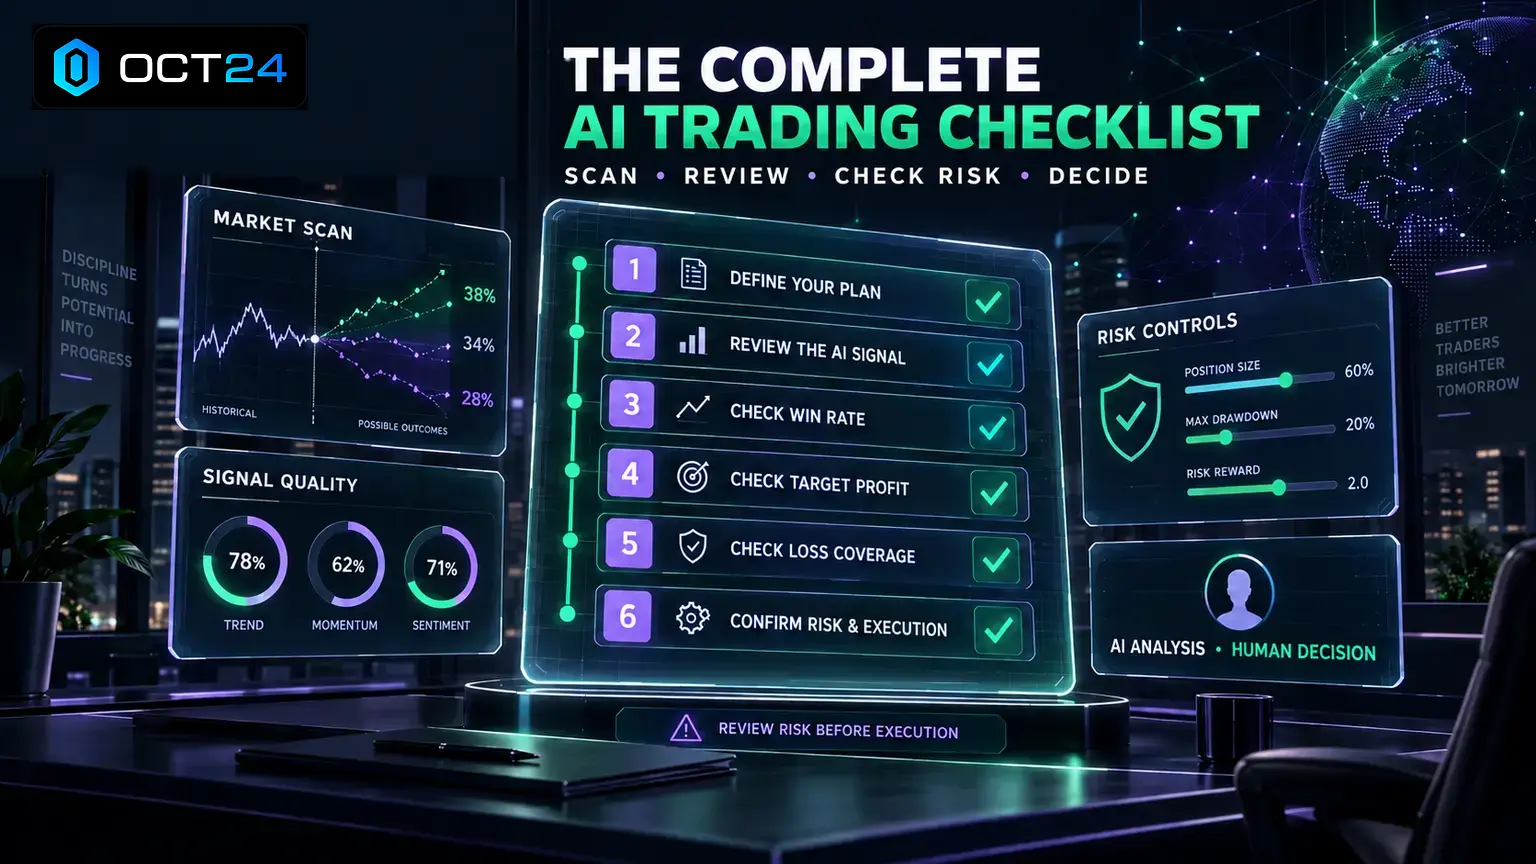
- Does the Win Rate look strong enough to review further?
- Does the Target Profit make sense for the opportunity?
- Does Loss Coverage fit my account size and comfort level?
- Do the three metrics support each other?
- Am I entering because the dashboard looks balanced, not because I feel rushed?
This process is especially helpful for beginners because it turns the dashboard into a repeatable checklist.
Performance Metrics vs Decision Metrics
Not every dashboard metric has the same purpose. Some metrics help traders decide whether to enter. Other metrics help traders review what happened afterward.
Decision metrics include Win Rate, Target Profit, and Loss Coverage. These are useful before activation because they help the trader understand the opportunity.
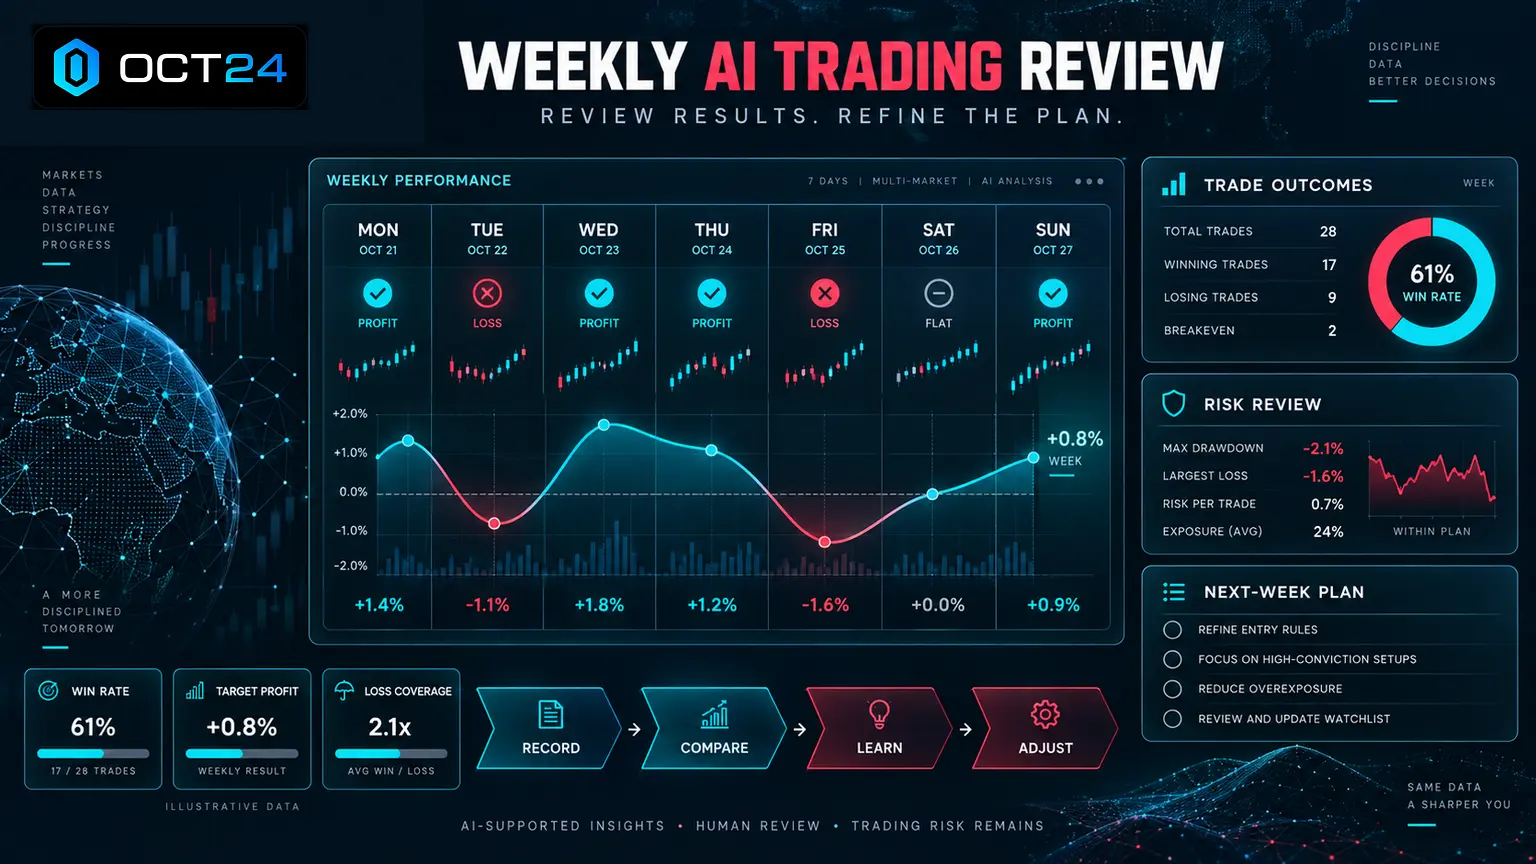
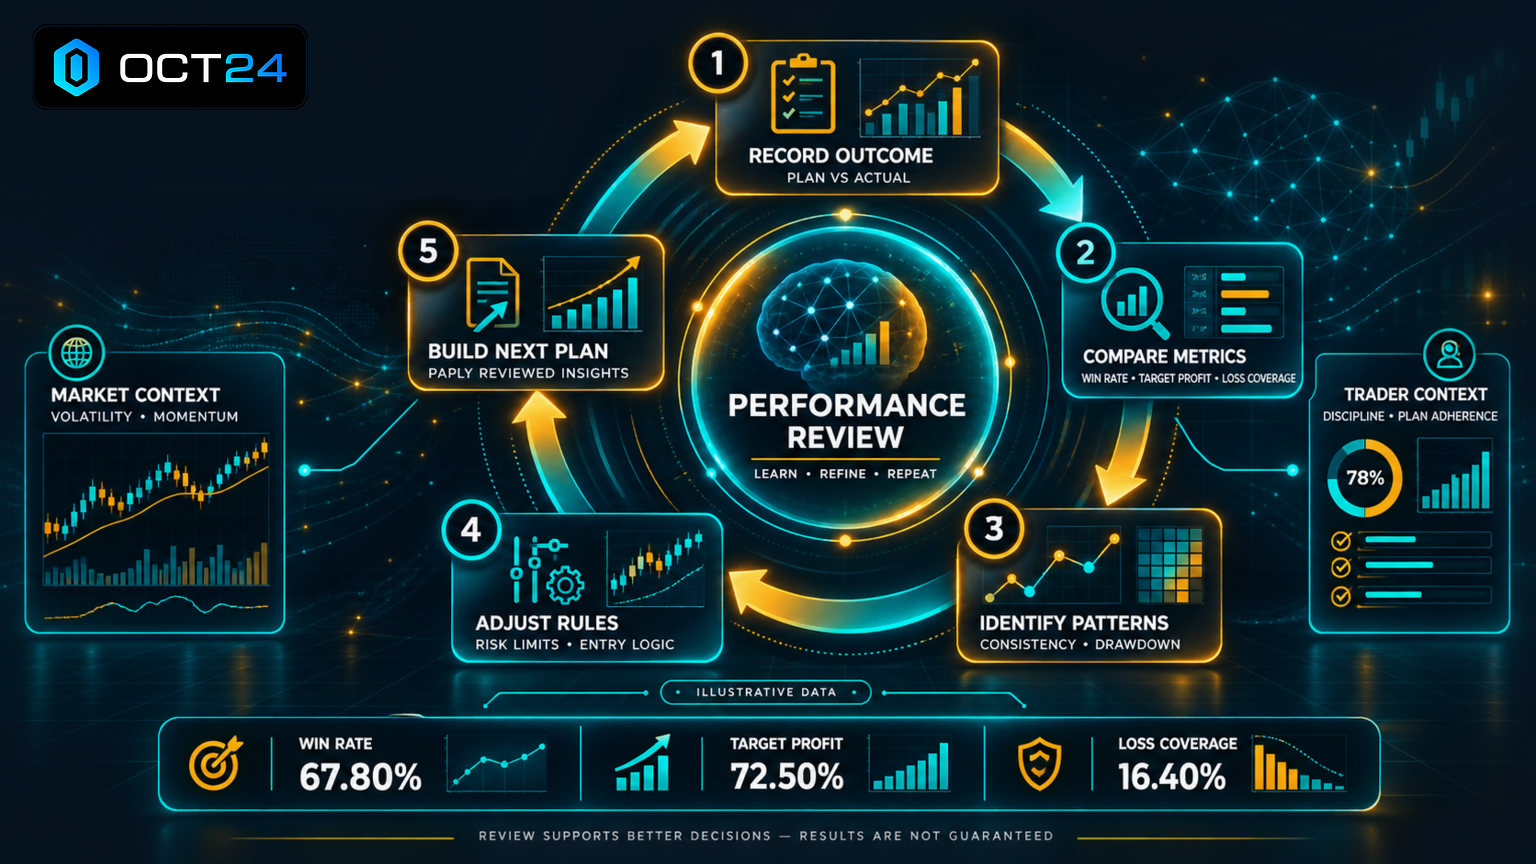
Performance metrics are different. They may help traders review results over time, spot patterns, and understand whether their behavior is improving. This connects with AI trading performance because one trade does not tell the whole story.
A trader should avoid judging a dashboard from one result. A winning trade does not prove the setup was perfect. A losing trade does not prove the dashboard was useless. The better approach is to review decisions over time.
Why Simple Dashboards Can Be Better for Beginners
Some traders think a trading dashboard needs dozens of indicators to be useful. That is not always true.
For beginners, too much information can create confusion. If a dashboard shows too many charts, alerts, indicators, and data points, the trader may struggle to know what matters.
A simpler crypto trading dashboard can be more useful when it highlights the metrics that directly support the decision. With OCT24, that means focusing on the AI-supported opportunity and the key metrics presented with it.
This is one reason choosing the right AI trading platform matters. A platform should make the trading process easier to understand, not harder.
How Dashboard Metrics Help Traders Stay Objective
Dashboard metrics help traders stay objective because they give the trader something concrete to review. Instead of acting on mood, the trader reviews the signal information.
This connects directly with AI helps traders stay objective. When a trader is nervous, excited, or impatient, a clear dashboard can slow the decision down just enough to create a better process.
OCT24 supports this by presenting key metrics before activation. The user still has a decision to make, but the decision is not based only on a feeling.
Objectivity does not mean the trader will always be right. It means the trader has a clearer reason for acting or skipping.
Dashboard Metrics During Volatile Markets
Volatile markets can make dashboard metrics even more important. Fast movement can make traders feel pressure to enter quickly.
When learning how AI handles market volatility, traders should remember that volatility can create both opportunity and risk. A dashboard may help organize the opportunity, but it cannot control the market.
During volatile conditions, Win Rate, Target Profit, and Loss Coverage should be reviewed with extra care. A trade may look attractive, but the trader still needs to consider whether the possible movement fits their risk comfort.
This is why dashboard simplicity matters. In fast markets, traders need clear information, not clutter.
Dashboard Metrics During Sideways Markets
Sideways markets create a different challenge. Instead of panic, traders may feel boredom or impatience.
A good dashboard can help traders avoid forcing trades during quiet conditions. If the key metrics do not feel balanced, the trader can choose not to activate the trade.
This is connected to AI trading during sideways markets because not every market condition produces a strong opportunity. Sometimes the best decision is to wait.
OCT24 can present AI-supported opportunities, but users do not need to activate every trade. Skipping can be part of responsible trading.
How Dashboards Can Help Reduce Common Mistakes
Trading dashboards can help reduce common AI trading mistakes when traders use them as a review tool instead of a shortcut.
A trader may make mistakes when they focus only on profit, ignore downside, overtrust one number, or enter too many trades in a row. A clear dashboard can help bring the decision back to the full setup.
- Do not treat Win Rate as a guarantee.
- Do not chase the highest Target Profit.
- Do not ignore Loss Coverage.
- Do not activate trades because of boredom.
- Do not assume one win proves the next trade will win.
- Do not risk more than you are comfortable losing.
These reminders are simple, but they matter. A dashboard is only useful if the trader uses it with discipline.
Where the G6 Trading Bot Fits Into the Dashboard
The G6 Trading Bot fits into this topic because it gives users a fast, simplified trading experience. The user reviews the available metrics and decides whether to activate the bot.
The important point is that speed should not replace review. A quick dashboard can support efficient decision-making, but the trader should still check Win Rate, Target Profit, and Loss Coverage before acting.
This is where one-click trading can be helpful when used responsibly. The process is faster, but the trade still carries risk.
How to Build a Dashboard Review Routine
A dashboard review routine helps traders use the same process every time. This makes the decision more consistent and easier to review later.
A simple routine may look like this:
- Review the opportunity calmly.
- Check Win Rate.
- Check Target Profit.
- Check Loss Coverage.
- Decide whether the trade fits your account.
- Avoid activating if one metric feels uncomfortable.
- Review the result later without overreacting.
This supports a consistent trading routine because the trader is not changing their process every time the market feels different.
What AI Trading Dashboards Cannot Guarantee
AI trading dashboards cannot guarantee profit, accuracy, or safety. They can help traders review information, but they cannot remove uncertainty from crypto markets.
Even a clean dashboard with strong-looking metrics can lead to a losing trade. Market conditions can change quickly, liquidity can shift, and volatility can move against the trade.
OCT24 does not remove trading risk or guarantee results. The platform can perform most of the market analysis and present AI-supported trading signals, but the trader remains responsible for exposure, capital allocation, and execution decisions.
A good dashboard should make risk easier to see, not easier to ignore.
SEO-Friendly Summary: The Metrics That Matter Most
For traders searching for the best AI trading dashboard metrics, the most important numbers are the ones that support better decisions. In the OCT24 experience, those metrics are Win Rate, Target Profit, and Loss Coverage.
Win Rate helps explain probability. Target Profit helps explain potential reward. Loss Coverage helps keep downside risk visible. Together, they help traders review an AI trading signal before deciding whether to activate a trade.
A crypto trading dashboard should be simple enough to understand quickly and clear enough to support responsible trading. It should help the trader compare risk and reward without suggesting that any outcome is guaranteed.
How Beginners Should Read an AI Trading Dashboard
Beginners should read an AI trading dashboard from left to right in a calm, repeatable order. The goal is not to find the most exciting number. The goal is to understand whether the trade makes sense before taking action.
Start with the main signal. Then check Win Rate, Target Profit, and Loss Coverage. If one of those numbers feels unclear or uncomfortable, slow down. A dashboard is useful because it gives the trader a reason to pause before entering.
New traders often make the mistake of treating a dashboard like a prediction screen. It is better to treat it like a decision screen. The dashboard gives useful information, but the trader still needs to decide whether the trade fits their account and risk comfort.
This is especially important on OCT24 because the experience is simple and fast. The platform does most of the market scanning, but the user still needs to review the available metrics responsibly.
Dashboard Metric Mistakes to Avoid
One common mistake is reading dashboard metrics separately. A trader may see a strong Win Rate and ignore everything else. Another trader may see a high Target Profit and forget to check Loss Coverage.
A better approach is to ask how the numbers work together. If the Win Rate looks strong, does the Target Profit still make sense? If the Target Profit looks exciting, does the Loss Coverage still feel acceptable? If Loss Coverage feels uncomfortable, is the trade really worth taking?
Another mistake is assuming that more data always means better decisions. A crowded dashboard can make beginners feel more informed while actually making the decision harder. Simple metrics can be more helpful when they are tied directly to action.
The strongest dashboard review process is clear, calm, and repeatable. It helps the trader act with more structure and less emotion.
Why OCT24 Keeps the Dashboard Decision Simple
OCT24’s simplified dashboard approach is useful because many beginner traders do not want to spend hours analyzing charts before every trade. They want a cleaner way to review AI-supported crypto opportunities.
The platform does not currently show every detail behind the trade. It does not provide a full research report for each asset or show exact entry and exit details for every opportunity. Instead, the user focuses on the key metrics that matter most for the decision: Win Rate, Target Profit, and Loss Coverage.
This simplicity can help reduce confusion. It also keeps responsibility clear. OCT24 can present the opportunity and the main metrics, but the trader still decides whether to activate the trade and how much exposure is appropriate.
For SEO purposes, this is the core point: the best AI trading dashboard is not the dashboard with the most noise. It is the dashboard that helps traders review crypto trading signals, compare risk and reward, and make a more informed trading decision.
FAQs
What metrics matter most on an AI trading dashboard?
The most important AI trading dashboard metrics are usually Win Rate, Target Profit, and Loss Coverage. These help traders review probability, potential reward, and possible downside before entering a trade.
Is Win Rate the most important dashboard metric?
Win Rate is important, but it should not be reviewed alone. A trader should compare it with Target Profit and Loss Coverage before making a decision.
Does a high Target Profit mean a better trade?
Not always. A high Target Profit can look attractive, but it may not fit every trader’s risk comfort. The full dashboard should be reviewed before activation.
Does Loss Coverage remove trading risk?
No. Loss Coverage helps traders review downside risk, but it does not make a trade risk-free or guarantee protection from losses.
Does OCT24 show full asset research on the dashboard?
OCT24 currently focuses on simplified trade information such as Win Rate, Target Profit, and Loss Coverage. It does not show full asset research, exact entry points, or exact exit points for every opportunity.
Can a dashboard help beginners trade more responsibly?
Yes. A clear dashboard can help beginners slow down and review key metrics before acting. It can support discipline, but it does not replace responsible capital management.
How does OCT24 use AI trading dashboard metrics?
OCT24 scans crypto market conditions, identifies potential opportunities, and presents AI-supported signals with key dashboard metrics. The trader reviews the information and decides whether to activate the trade.
Should traders activate every dashboard signal?
No. Traders should not activate every signal automatically. They should review the metrics, consider their risk comfort, and skip trades that do not fit their plan.
Where can I learn more about OCT24?
You can visit About OCT24 to learn more about the platform or Start Trading with OCT24 when you are ready to explore AI-supported crypto trading.

Final Thoughts
AI trading dashboards are useful when they make decisions clearer. The best dashboard metrics are not the ones that look the most exciting. They are the ones that help traders understand probability, potential reward, and possible downside.
For OCT24 users, the key metrics are Win Rate, Target Profit, and Loss Coverage. These numbers help turn a fast crypto trading opportunity into a more structured review process.
OCT24 performs most of the market analysis by scanning crypto market conditions, identifying potential opportunities, and presenting AI-supported trading signals. The trader still needs to review the available metrics, manage exposure, allocate capital responsibly, and decide whether to activate the trade.
A good dashboard does not remove risk. It helps traders see risk more clearly before they act.
Learn more about OCT24, or Start Trading with OCT24 when you are ready to explore a simpler way to review AI-supported crypto trading opportunities.