
Best Indicators for AI Trading
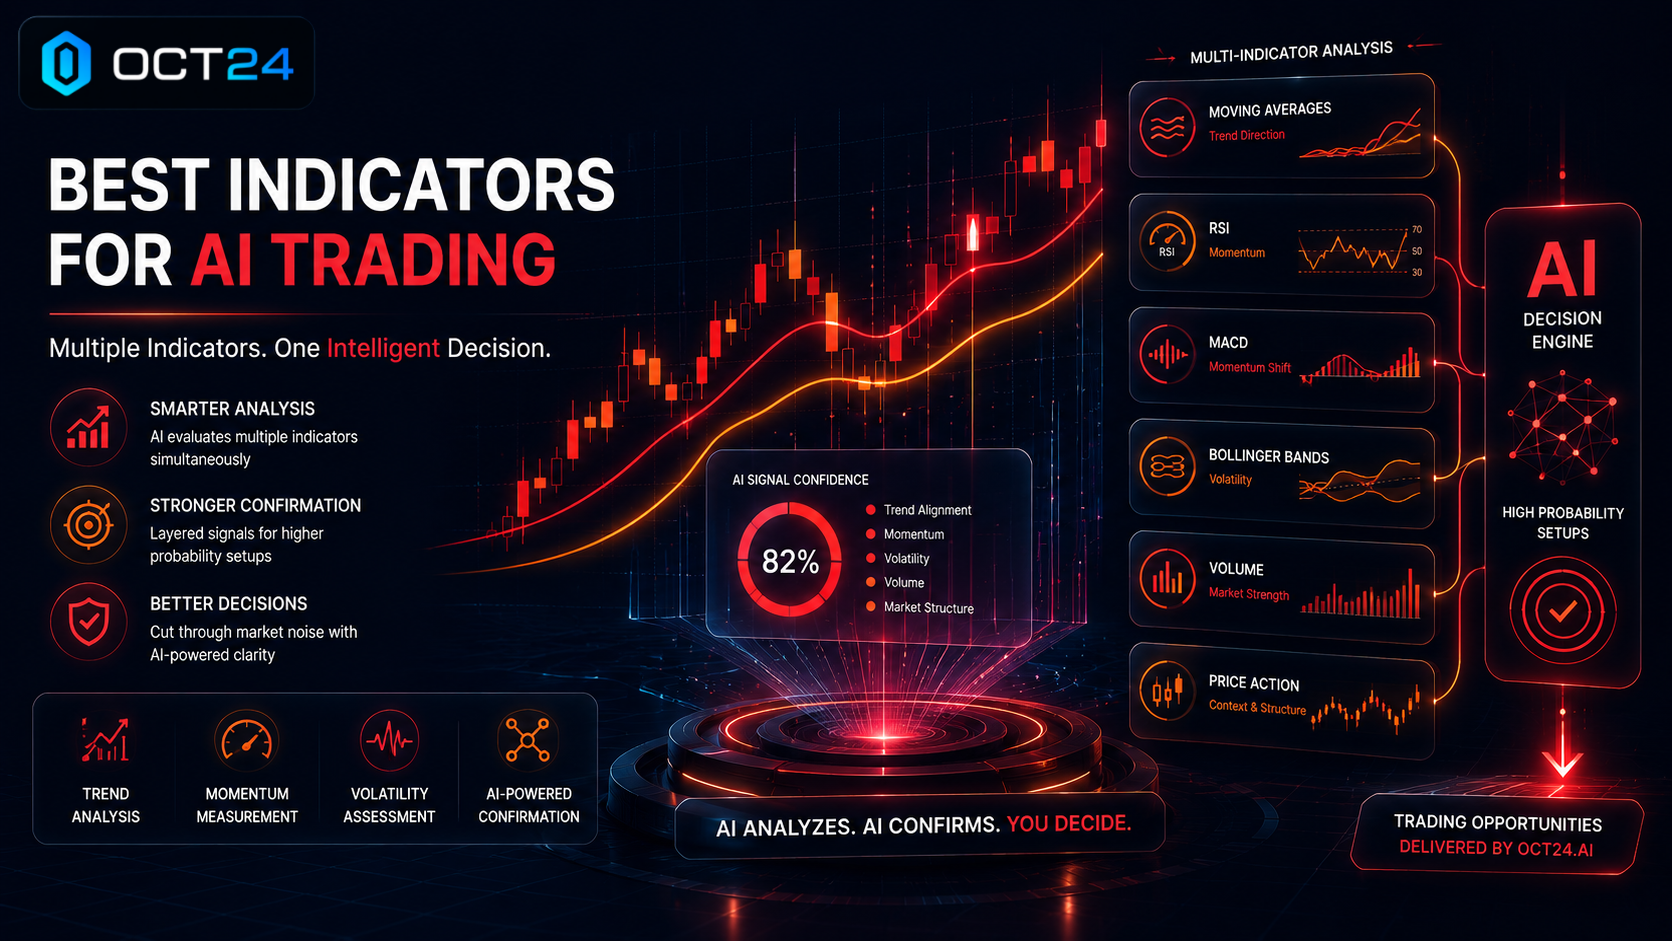
If you've been learning about AI-powered trading, you've probably come across terms like RSI, MACD, and Moving Averages. These technical indicators play an important role in helping traders understand market behavior, but they become even more powerful when analyzed by artificial intelligence. Understanding the Best Indicators for AI Trading doesn't mean you need to memorize complex formulas. Instead, it means recognizing how these indicators work together to provide a clearer picture of market conditions. Platforms like OCT24 continuously evaluate multiple technical indicators in real time, helping traders identify potential opportunities faster and more efficiently than manually analyzing charts.
Think of technical indicators like the dashboard in your car. Your speedometer, fuel gauge, and engine temperature each tell you something different, but none of them alone provides the complete picture. Together, they help you make informed decisions while driving. Technical indicators work much the same way. Each measures a different aspect of market behavior, and when AI analyzes them together, traders receive a more comprehensive view of potential trading opportunities.
Rather than monitoring dozens of charts and indicators simultaneously, OCT24 automatically evaluates multiple technical signals in the background. Its AI analyzes market conditions continuously before presenting structured trading opportunities, allowing users to focus on making informed trading decisions instead of performing time-consuming manual analysis.
Many of the advantages discussed in AI Trading vs Manual Trading become even more apparent when you see how AI analyzes multiple indicators simultaneously.
Why AI Uses Technical Indicators

Technical indicators are mathematical tools that help traders interpret price movement, momentum, volatility, and market trends. While experienced traders often use them individually, AI can analyze numerous indicators simultaneously and identify relationships that would be difficult for humans to detect in real time.
AI primarily uses technical indicators to:
- Confirm emerging market trends
- Measure buying and selling momentum
- Evaluate market volatility
- Filter weaker trading signals
- Reduce emotional decision-making
Each indicator contributes a different piece of information. For example, one indicator might suggest a market is trending upward, while another measures whether buyers are beginning to lose momentum. Looking at only one signal could lead to misleading conclusions. AI instead compares multiple indicators before highlighting potential opportunities.
This is one of the reasons many traders choose AI Trading solutions. Rather than relying on a single technical signal, AI continuously evaluates multiple sources of market information before presenting potential trades.
OCT24 follows this same principle. Instead of depending on one indicator, its AI analyzes numerous technical signals simultaneously, combining trend analysis, momentum measurements, volatility data, and price action into a more complete assessment of current market conditions. This multi-indicator approach helps improve the quality of trading opportunities while reminding users that no indicator—or combination of indicators—can guarantee future market movements.
Technical indicators form the foundation of many successful AI Trading Strategies, helping systems evaluate trends, momentum, and volatility.
Quick Tip: Technical indicators work best when they confirm one another. Multiple signals pointing in the same direction generally provide stronger confidence than relying on a single indicator alone.
Moving Averages
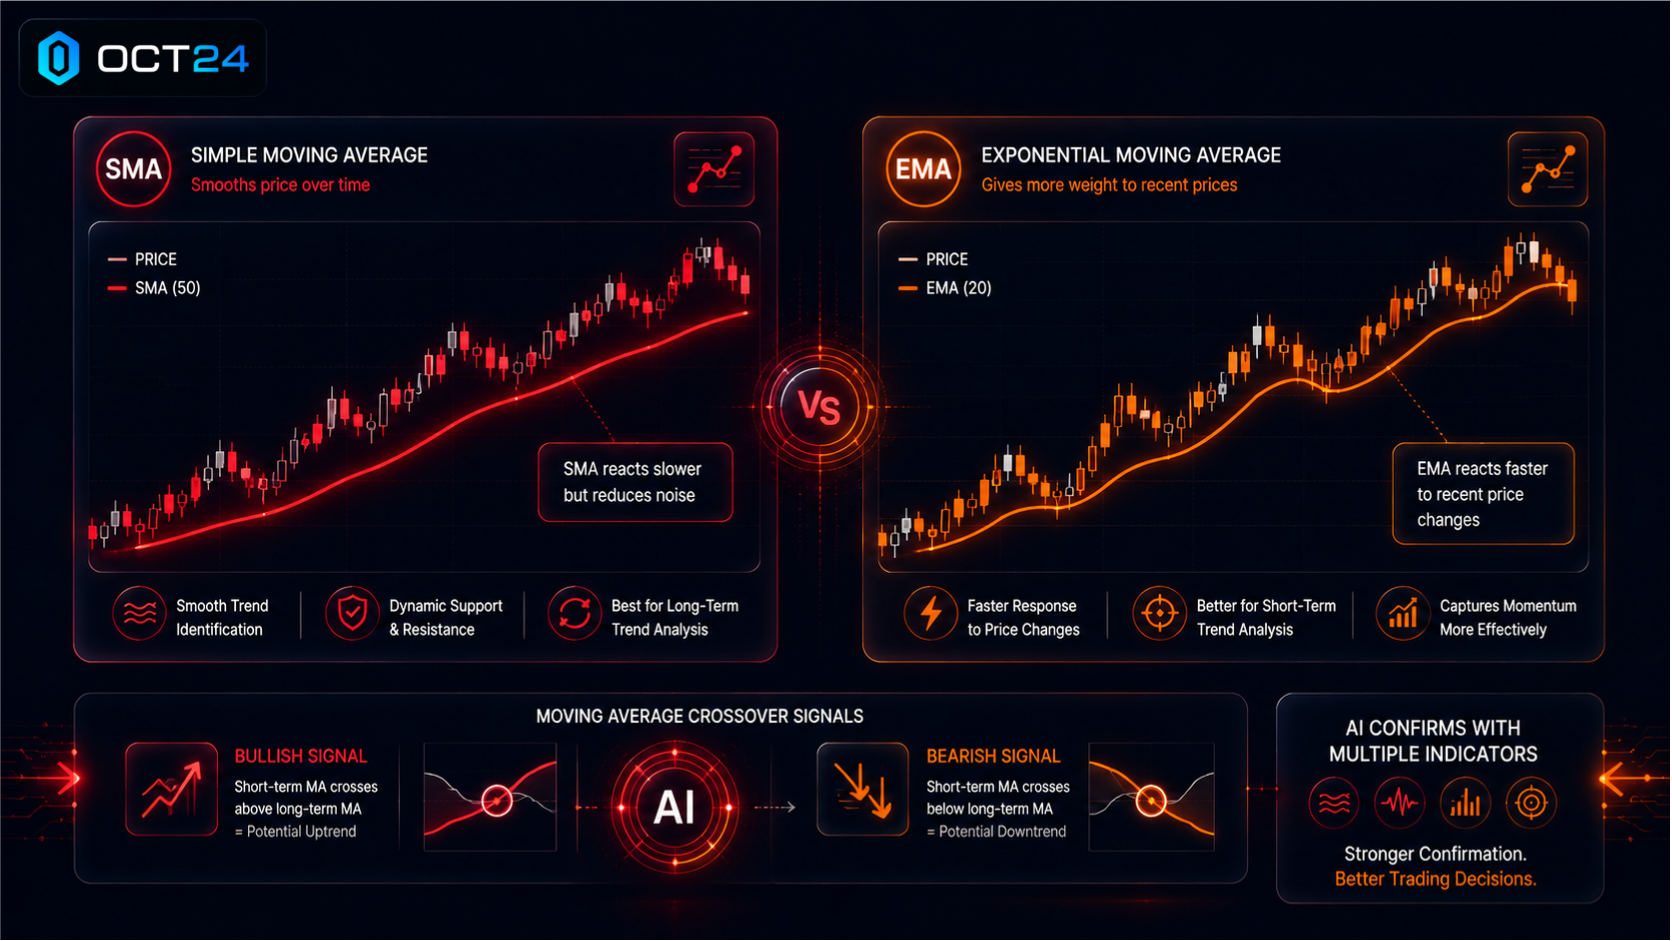
Moving averages are among the most widely used technical indicators in financial markets because they help smooth out short-term price fluctuations and reveal the underlying market trend.
The two most common types are:
- Simple Moving Average (SMA): Calculates the average price over a selected period.
- Exponential Moving Average (EMA): Places greater emphasis on more recent prices, allowing it to respond more quickly to changing market conditions.
Imagine watching waves at the beach. Individual waves constantly rise and fall, making it difficult to judge whether the tide is coming in or going out. A moving average helps reveal the overall direction of the tide rather than focusing on every individual wave.
Traders often use moving averages to identify:
- Overall market trend
- Dynamic support and resistance
- Potential trend reversals
- Moving average crossovers
For example, if a shorter-term moving average crosses above a longer-term moving average, it may suggest that buying momentum is increasing. Conversely, a downward crossover may indicate weakening market conditions.
It's important to remember that moving averages are lagging indicators. They react to price changes rather than predict them, making them most effective when combined with additional technical analysis.
OCT24 continuously incorporates moving averages into its AI-powered market analysis. Rather than treating them as standalone signals, the platform compares moving average behavior alongside other technical indicators to build a more balanced view of current market conditions before presenting trading opportunities.
Relative Strength Index (RSI)
The Relative Strength Index, commonly known as RSI, measures the speed and magnitude of recent price movements. It helps traders identify whether buying or selling activity may be becoming excessive.
RSI generally moves between 0 and 100.
Traditionally:
- Above 70 may indicate overbought conditions.
- Below 30 may indicate oversold conditions.
These levels don't necessarily predict immediate reversals. Instead, they suggest that momentum may be reaching an extreme.
For example, imagine a runner sprinting at maximum speed. They might continue running quickly for a while, but eventually fatigue becomes more likely. Similarly, markets can remain overbought or oversold longer than many traders expect.
RSI also measures market momentum. Strong momentum often supports existing trends, while weakening momentum can signal that price movements deserve closer attention.
Another concept traders occasionally encounter is divergence, where price moves in one direction while RSI moves differently. Although divergence can sometimes suggest changing market conditions, it should never be viewed as a guaranteed reversal signal.
Because RSI offers only one perspective on the market, OCT24 never relies on it in isolation. Instead, its AI compares RSI readings alongside price action, trend analysis, volatility, and additional technical indicators before identifying potential trading opportunities. This helps reduce the likelihood of acting on misleading signals that may appear when viewing RSI alone.
Quick Tip: High RSI does not automatically mean prices will fall, just as low RSI does not automatically mean prices will rise. Context always matters.
MACD (Moving Average Convergence Divergence)
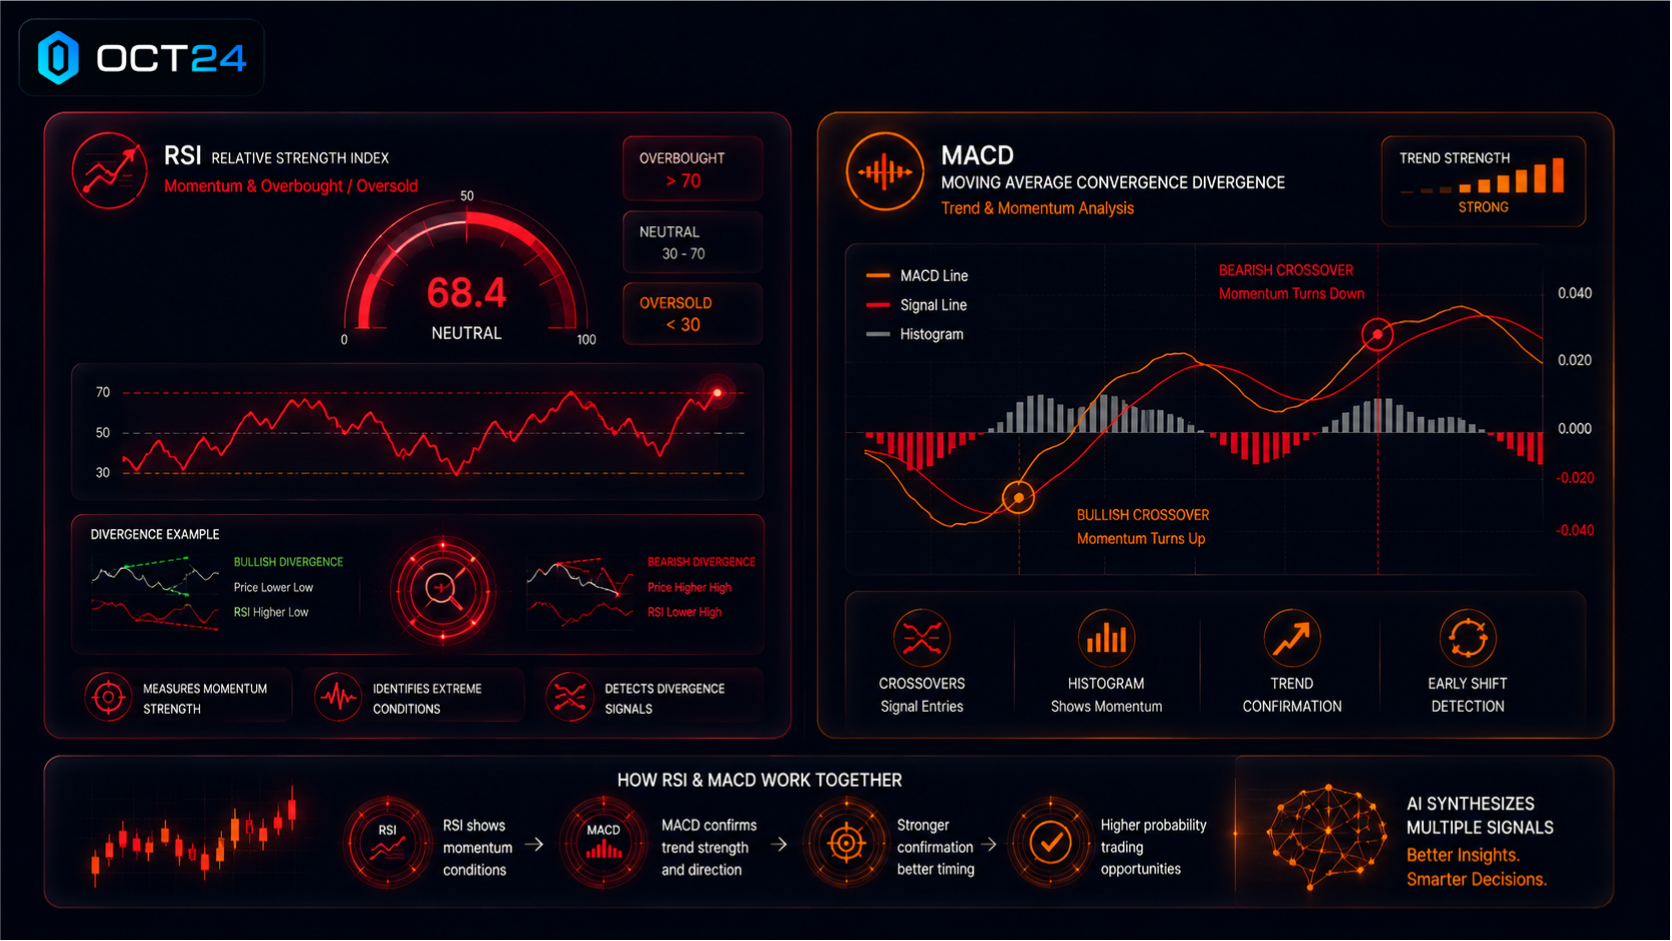
The Moving Average Convergence Divergence (MACD) indicator helps traders evaluate both market momentum and trend strength. Although its name sounds complicated, its purpose is relatively straightforward: it measures the relationship between two moving averages to identify changes in market momentum.
Many traders use MACD to identify:
- Strengthening trends
- Weakening trends
- Momentum shifts
- Potential crossover signals
- Trend confirmation
One of the most common MACD signals occurs when its faster-moving line crosses above or below the slower signal line. These crossovers may suggest that buying or selling momentum is beginning to change.
However, MACD should not be viewed as a standalone trading system. Like all technical indicators, it performs best when combined with additional market information.
For example, if MACD indicates strengthening upward momentum while moving averages confirm an uptrend and RSI shows balanced momentum, these multiple confirmations may provide greater confidence than any individual indicator alone.
OCT24 continuously evaluates MACD alongside numerous other technical indicators before presenting trading opportunities. Instead of reacting to every crossover, the platform's AI looks for situations where MACD aligns with broader market conditions, helping filter out weaker signals while identifying opportunities supported by multiple forms of technical confirmation.
Understanding how these indicators complement one another provides an important foundation for interpreting AI-generated trading opportunities. In the next section, you'll learn how additional tools such as Bollinger Bands further improve market analysis, why AI combines multiple indicators instead of relying on a single signal, and how OCT24 brings all of these insights together to simplify technical analysis for traders.
Bollinger Bands
If you're unfamiliar with candlesticks or price movement, it's worth reviewing How to Read Crypto Charts before exploring more advanced technical indicators like Bollinger Bands.
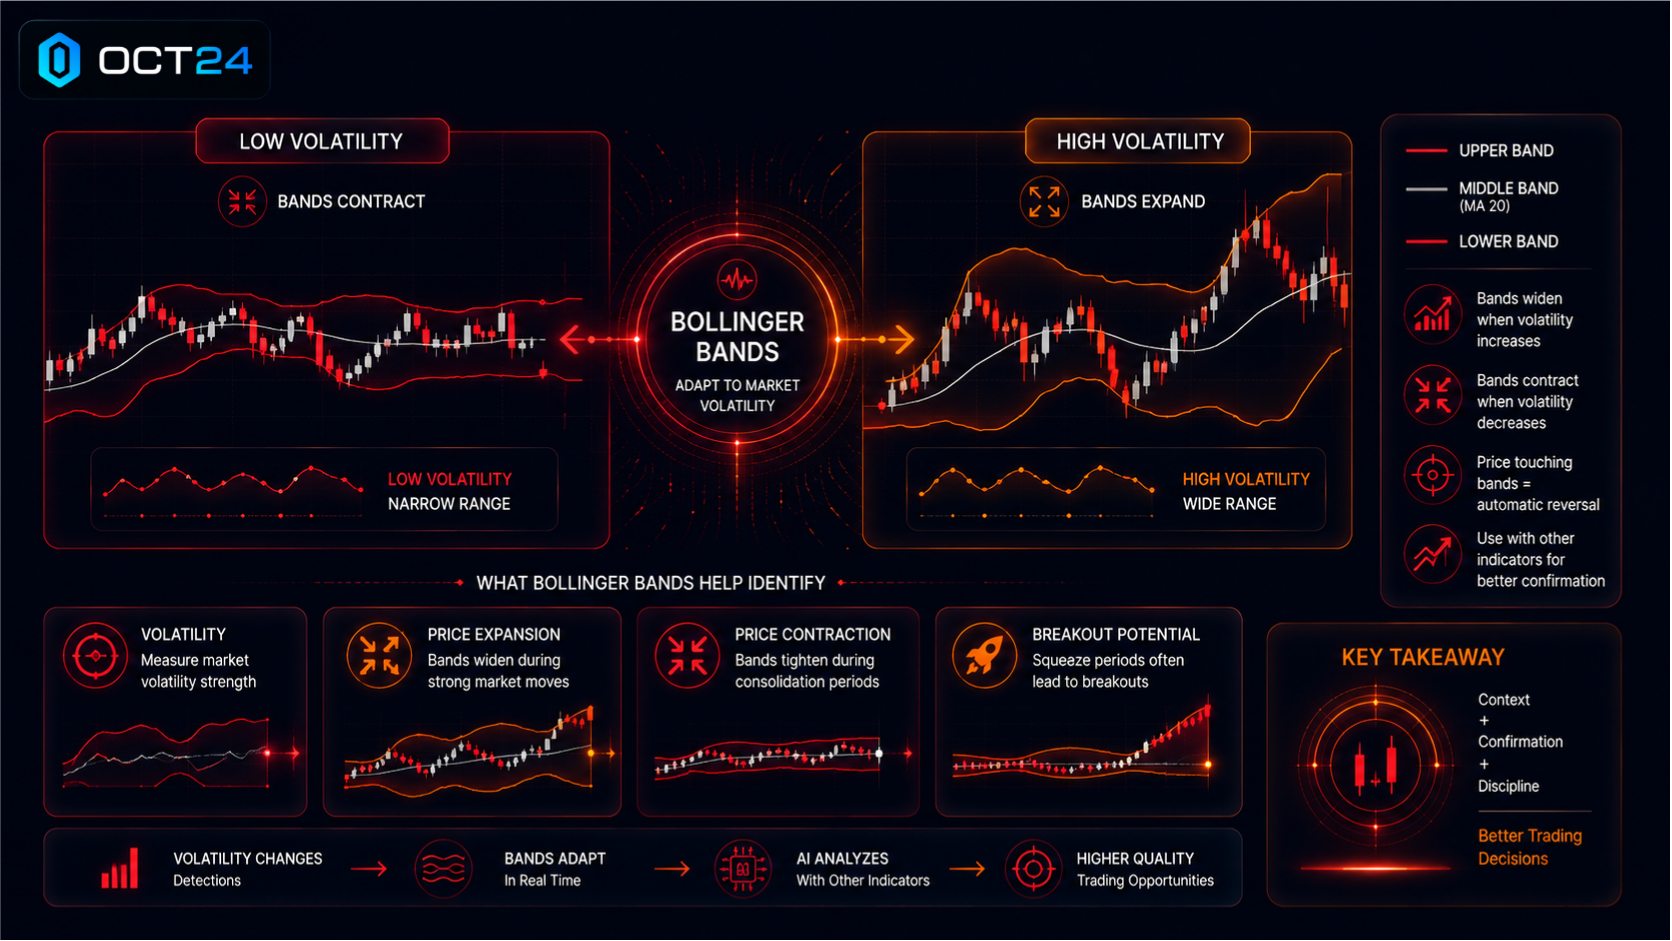
Bollinger Bands are popular technical indicators that help traders measure market volatility. Rather than focusing solely on price direction, they show how much prices are expanding or contracting over time, providing valuable insight into changing market conditions.
The indicator consists of three lines:
- A middle moving average
- An upper band
- A lower band
When markets become more volatile, the bands widen. When volatility decreases, the bands move closer together. This expansion and contraction can help traders understand whether the market is becoming more active or entering a quieter period.
Imagine stretching and releasing a rubber band. When it's pulled tight, it expands. When the tension eases, it contracts. Bollinger Bands behave in a similar way as market volatility changes.
Traders often use Bollinger Bands to identify:
- Periods of high volatility
- Periods of low volatility
- Potential breakout conditions
- Changing market momentum
One common misconception is that touching the upper or lower band automatically signals a reversal. In reality, prices can continue moving along either band during strong trends. A touch of the upper band simply indicates that price is trading near the upper end of its recent range, while a touch of the lower band indicates the opposite.
This is why Bollinger Bands work best alongside other technical indicators rather than on their own.
OCT24 continuously evaluates Bollinger Bands together with Moving Averages, RSI, MACD, price action, and market structure. By combining multiple technical signals, the platform gains a more complete understanding of changing market conditions instead of relying on a single indicator to make trading decisions.
Quick Tip: Bollinger Bands measure volatility—not whether the market is about to reverse. Always consider trend direction and additional confirmations before making trading decisions.
Why AI Combines Multiple Indicators
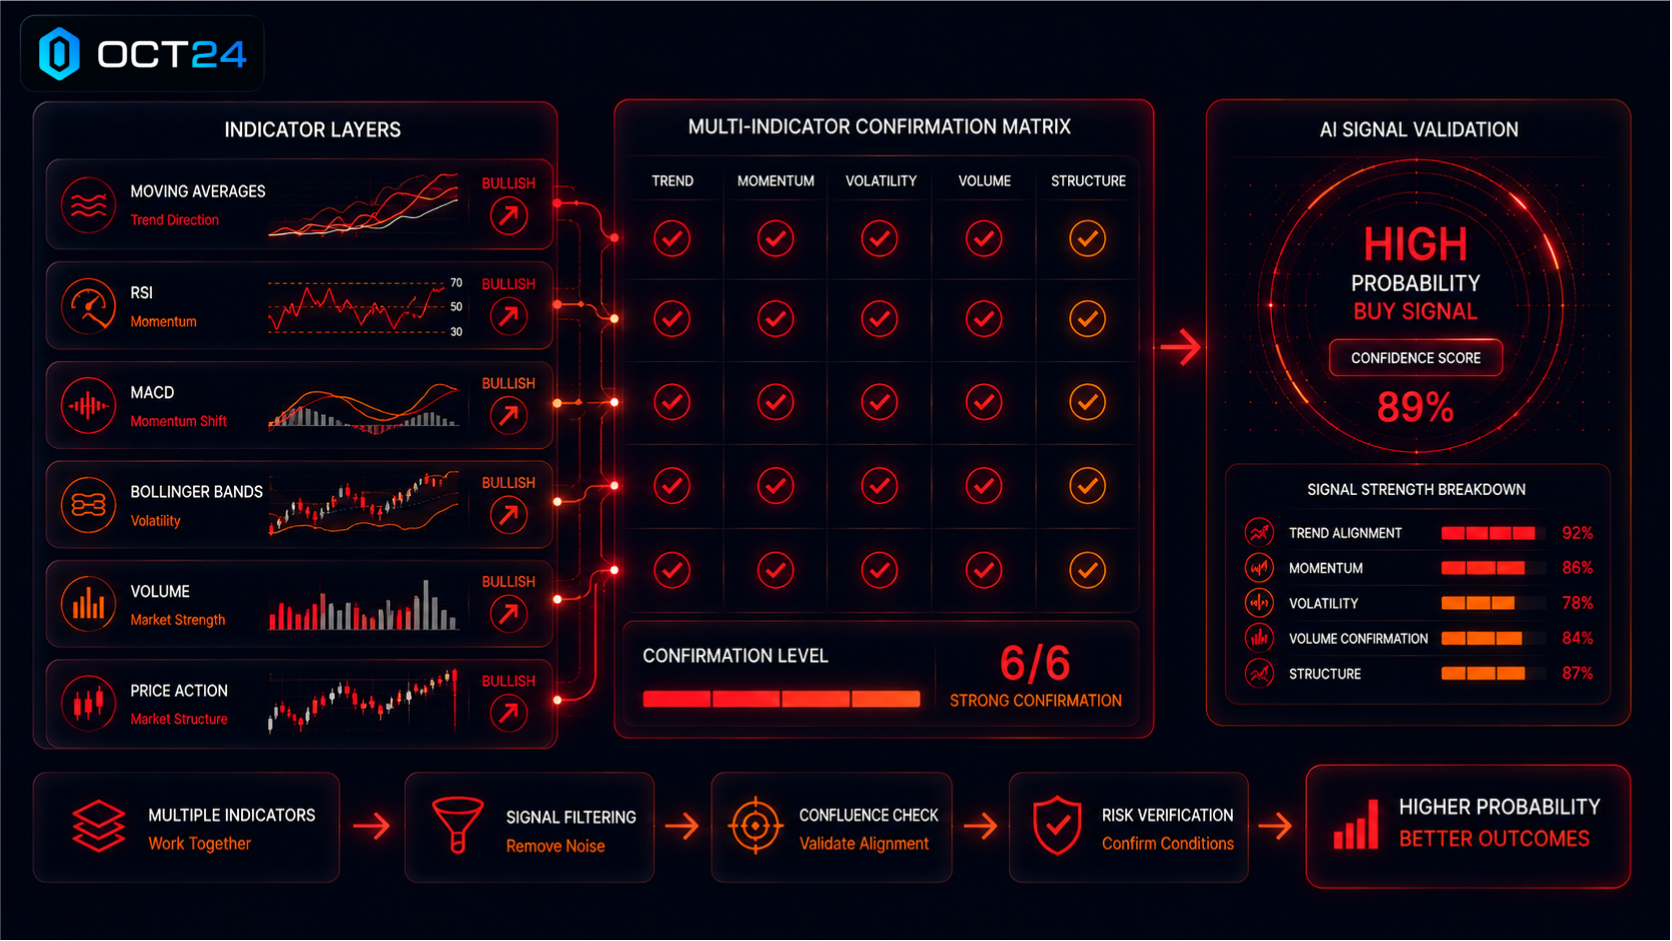
Every technical indicator has strengths, but every indicator also has limitations. A moving average may confirm the direction of a trend but provide little information about momentum. RSI measures momentum but may remain overbought or oversold during strong trends. MACD highlights momentum shifts but often reacts after price has already moved. Bollinger Bands measure volatility without indicating whether buyers or sellers are in control.
Looking at only one indicator can therefore produce unreliable or incomplete signals.
Unlike traditional Algorithmic Trading, which follows predefined rules, AI can evaluate multiple technical indicators together before highlighting opportunities.
Instead of asking, "What is RSI saying?" AI asks a much broader question:
Do several independent indicators point toward the same market opportunity?
For example, AI may compare:
- Moving Average alignment
- RSI momentum
- MACD crossover signals
- Bollinger Band expansion
- Price Action
- Trading Volume
When several of these indicators support the same market direction, confidence in a potential opportunity generally increases. If they disagree, AI can filter out weaker signals and continue monitoring until stronger confirmation appears.
This layered approach helps improve the quality of opportunities presented to traders, although it's important to remember that even multiple confirmations cannot guarantee profitable outcomes.
OCT24 follows this philosophy by continuously evaluating numerous technical indicators simultaneously. Rather than highlighting every possible setup, the platform filters weaker signals and prioritizes opportunities where several technical factors align. This allows traders to focus on higher-quality opportunities while remaining responsible for every final trading decision.
This ability to synthesize large amounts of market data is one of the key Benefits of AI Trading.
Common Beginner Mistakes When Using Indicators
Technical indicators are valuable tools, but they can easily be misunderstood by new traders. Learning what not to do is often just as important as learning how the indicators themselves work.
Relying on a Single Indicator
Some beginners assume one indicator provides all the answers.
For example, entering every trade simply because RSI falls below 30 may lead to disappointing results if the broader market trend remains strongly bearish.
Multiple confirmations generally produce better trading decisions than isolated signals.
Ignoring the Overall Trend
Markets often continue trending much longer than traders expect.
Buying against a strong downtrend simply because an indicator appears oversold can expose traders to unnecessary risk.
Trend direction should always provide important context for interpreting technical indicators.
Chasing Overbought or Oversold Signals
Many traders mistakenly believe overbought automatically means "sell" and oversold automatically means "buy."
In reality, strong trends can remain overbought or oversold for extended periods.
Indicators describe current market conditions—they don't predict future price movements.
Using Too Many Indicators
Adding more indicators doesn't always improve decision-making.
Instead, charts can become cluttered with conflicting information that makes analysis more confusing rather than more accurate.
Successful traders often focus on a small group of complementary indicators.
Ignoring Price Action
Indicators should support price analysis—not replace it.
Price action remains one of the most important sources of market information, while indicators simply help interpret what price is already doing.
Forgetting Risk Management
Even excellent technical analysis cannot eliminate trading risk.
Every trade carries uncertainty, which is why disciplined Trading Bot Risk Management remains essential regardless of how many technical confirmations appear.
AI-assisted analysis helps reduce many of these common mistakes by evaluating multiple indicators objectively and consistently. Rather than requiring traders to manually compare dozens of charts, OCT24 performs much of the technical analysis in the background, organizing the information into structured trading opportunities. Even so, traders remain fully responsible for deciding whether and how to execute each trade.
How OCT24 Uses Technical Indicators

Understanding individual indicators is valuable, but the real advantage comes from seeing how they work together in a live trading environment. Modern AI Trading Software like OCT24 automates this technical analysis while allowing traders to remain in control of execution.
OCT24 continuously monitors live cryptocurrency markets using specialized AI-powered trading bots designed for different trading styles and timeframes. Instead of relying on a single indicator, the platform combines multiple layers of technical analysis before presenting potential trading opportunities.
The platform continuously:
- Monitors live market data
- Evaluates Moving Averages
- Analyzes RSI
- Interprets MACD
- Detects Bollinger Band conditions
- Identifies support and resistance
- Monitors trend strength
- Ranks trading opportunities
- Supports one-click trade execution
These indicators work together as part of the broader process explained in How AI Identifies Trading Opportunities, where multiple technical signals are evaluated before a trade is prepared.
One example is the G6 Trading Bot, which specializes in analyzing the 1-minute timeframe. It continuously evaluates every new candlestick, combining technical indicators with price action to identify short-term trading opportunities as they develop.
While G6 focuses specifically on 1-minute market analysis, OCT24 is designed as a broader AI trading platform. Additional specialized trading bots will analyze other timeframes, allowing traders to choose strategies that best match their preferred trading style and investment objectives.
Users don't need to:
- Memorize dozens of technical indicators
- Watch charts throughout the day
- Analyze every market manually
- Configure complex Automated Trading systems
Instead, OCT24 performs the technical analysis continuously in the background, presenting structured trading opportunities while leaving the final execution decision entirely in the trader's hands. This approach combines the efficiency commonly associated with AI Trading Bots with the flexibility and control that many traders prefer.
If you'd like to learn more about the technology behind the platform, visit the About OCT24 page for additional information.
Frequently Asked Questions
What are the best indicators for AI trading?
There is no single "best" indicator. AI typically combines Moving Averages, RSI, MACD, Bollinger Bands, price action, and trading volume to build a more complete understanding of market conditions.
Which indicator is the most accurate?
No technical indicator is consistently accurate on its own. The strongest analysis usually comes from combining several indicators that confirm one another.
Why does AI use multiple indicators?
Each indicator measures a different aspect of the market, such as trend, momentum, or volatility. Combining them helps reduce false signals and improves overall analysis.
Does RSI guarantee market reversals?
No. RSI simply measures momentum and identifies overbought or oversold conditions. Markets can remain in these conditions longer than many traders expect.
What does MACD tell traders?
MACD helps identify trend strength, momentum shifts, and possible changes in market direction through moving average relationships.
Are Bollinger Bands reliable?
Yes, when used correctly. Bollinger Bands are excellent for measuring volatility but should always be interpreted alongside other technical indicators.
Does OCT24 analyze indicators automatically?
Yes. OCT24 continuously evaluates multiple technical indicators across specialized trading bots, helping identify structured trading opportunities without requiring users to perform every analysis manually.
How do I get started?
The easiest way to begin is to learn the fundamentals of technical analysis, understand how indicators work together, and then Start Trading with OCT24 to experience AI-assisted market analysis firsthand.
Final Summary
Technical indicators help traders better understand what the market is doing, but no single indicator tells the complete story. Moving Averages reveal trend direction, RSI measures momentum, MACD highlights changes in momentum and trend strength, while Bollinger Bands provide insight into market volatility.
The most effective market analysis comes from combining multiple indicators and looking for confirmation rather than relying on any one signal. Even then, successful trading still depends on disciplined risk management and thoughtful decision-making.
OCT24 simplifies this process by continuously evaluating multiple technical indicators across specialized AI trading bots, identifying higher-quality trading opportunities while allowing traders to remain fully in control of every execution decision. Whether you're comparing technical signals, exploring AI vs Algorithmic Trading, or refining your Position Sizing Controls and Portfolio Diversification Tools, combining AI-powered analysis with sound trading discipline can help you make more informed decisions in fast-moving cryptocurrency markets.