
How AI Uses Technical Analysis
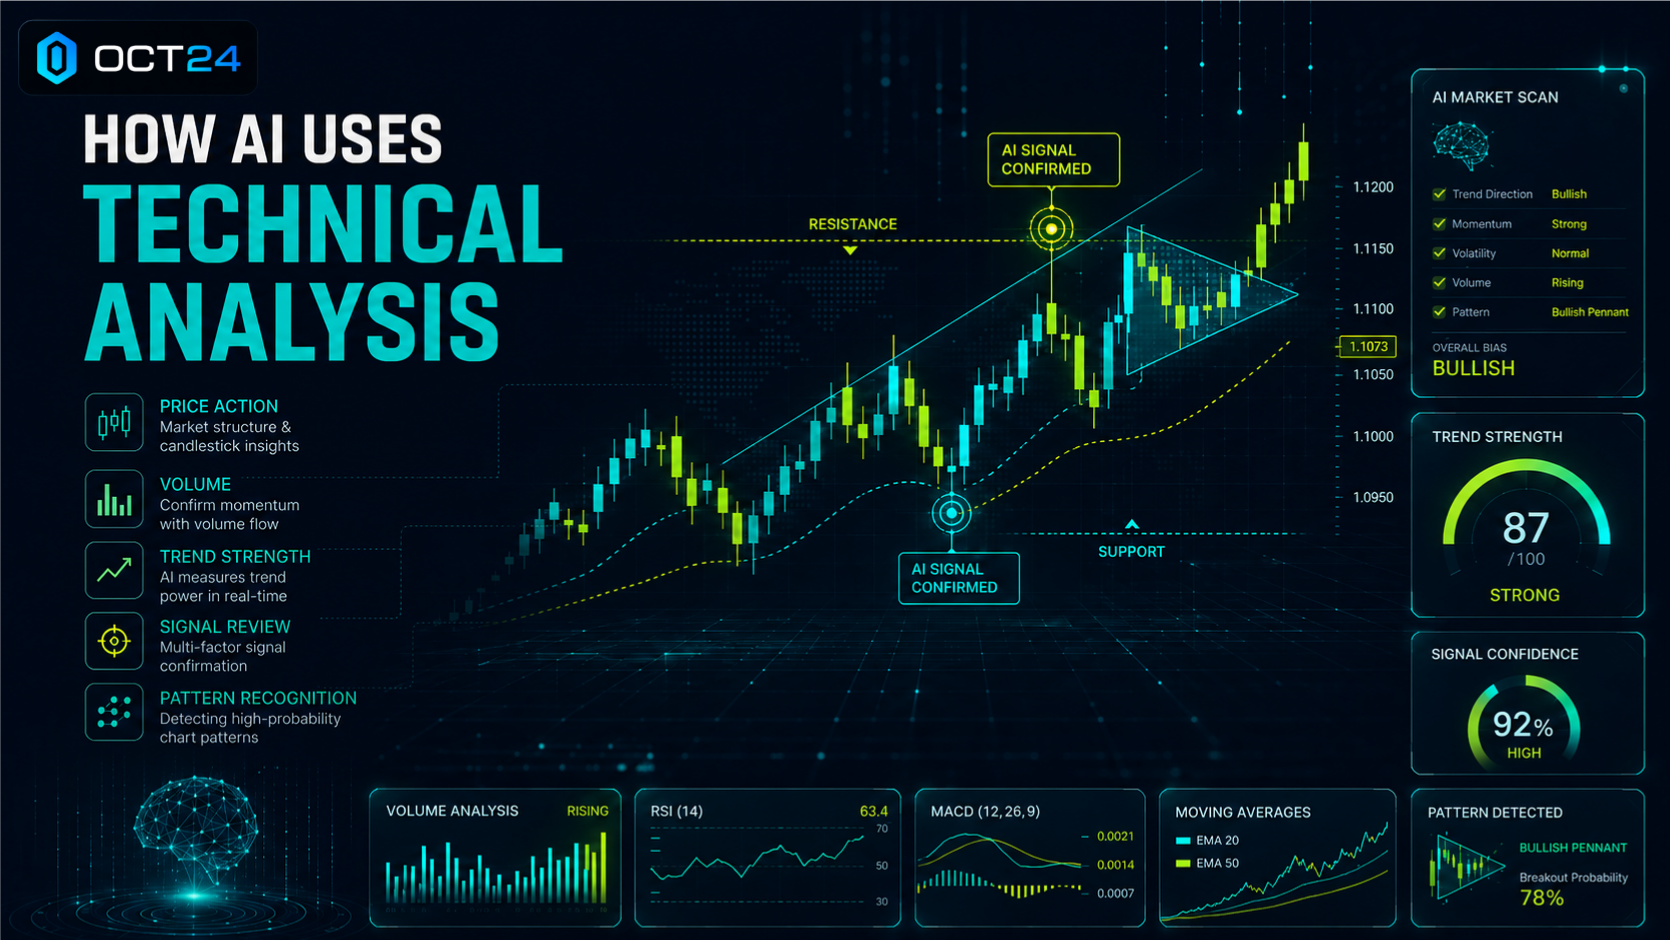
AI Technical Analysis is the process of using artificial intelligence to study price action, volume, market trends, indicators, and chart patterns so traders can evaluate potential opportunities more efficiently. For active traders, technical analysis is one of the most practical ways to understand what the market is doing right now, and AI can make that process faster, more consistent, and easier to scale across multiple assets.
At its core, technical analysis helps traders answer questions such as: Is the market trending? Is momentum increasing or fading? Is price approaching an important support or resistance level? Is volatility expanding? Are buyers or sellers gaining control?
For readers who have already learned the basics of AI Trading, this article goes one step deeper. Instead of explaining what AI trading is, we will focus on how AI reads market behavior through technical data and how that information can support better short-term trading decisions.
AI can process technical data faster than manual chart review, but it does not remove uncertainty. Even strong setups can fail. A signal may look promising, but market conditions, liquidity, news, and risk exposure still matter.
That is why OCT24 approaches AI-powered analysis as part of a structured trading workflow. Instead of treating indicators as isolated signals, OCT24 helps traders review technical data, market context, and risk together so they can make more informed decisions.
What Is Technical Analysis?
Technical analysis is a method traders use to study market behavior by looking at price charts, volume, trends, indicators, and patterns. Instead of asking what an asset is worth long term, technical analysis focuses on what the market is doing and how traders may be reacting in the short term.
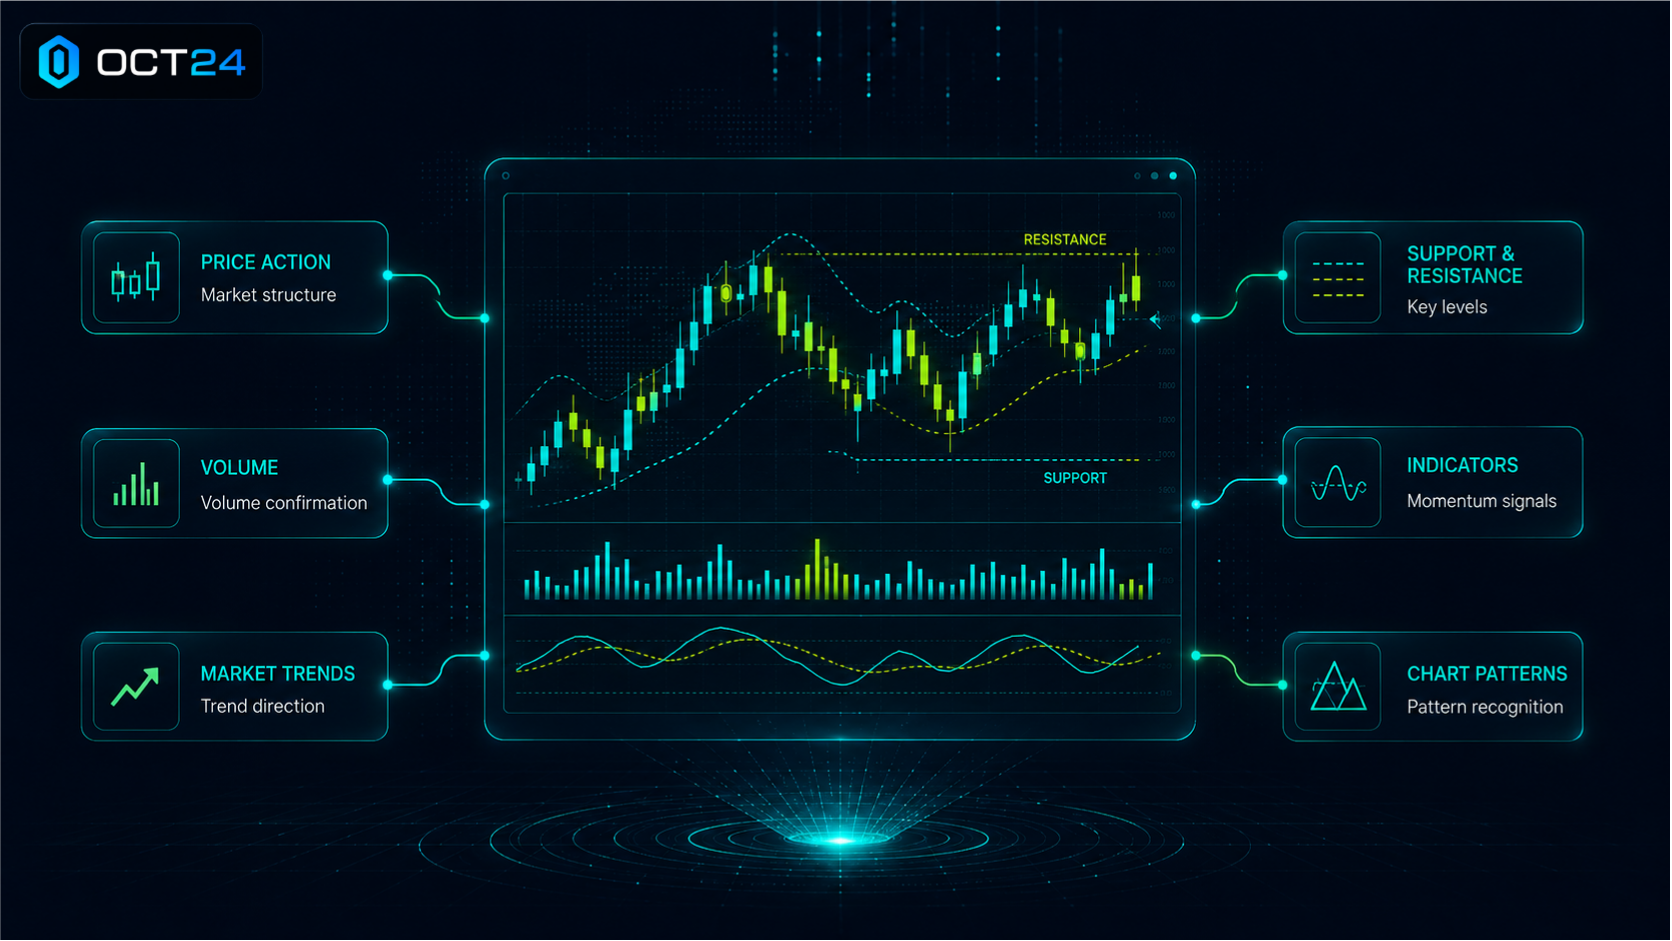
A simple way to think about it is this: technical analysis studies the “footprints” left by buyers and sellers.
When price rises with strong volume, it may suggest growing demand. When price fails repeatedly near the same level, that area may become resistance. When price pulls back but holds above a moving average, traders may view that as a sign that the trend is still intact.
Technical analysis is especially useful for active trading because it helps traders evaluate timing. A long-term investor may focus more on fundamentals, adoption, revenue, or macroeconomic trends. An active trader is often more interested in entries, exits, momentum, volatility, and risk levels.
For AI-assisted traders, technical analysis provides the raw material that AI systems can evaluate. OCT24 can help traders organize this type of technical data into a clearer decision-making process, rather than forcing them to manually scan every chart, indicator, and possible setup.
Price Action
Price action refers to how an asset’s price moves over time. Traders use price action to study market behavior without relying only on indicators.
For example, if Bitcoin moves from $65,000 to $68,000, pulls back to $66,500, and then pushes toward $69,000, traders may see that as a potential uptrend. The market is making higher highs and higher lows, which can suggest that buyers are still in control.
AI can evaluate price action across many assets at once. Instead of a trader manually checking dozens of charts, AI can detect whether price is trending, ranging, breaking out, or reversing.
Volume
Volume shows how much of an asset is being traded during a certain period. It helps traders understand whether a price move has strong participation behind it.
A breakout with rising volume may be more meaningful than a breakout with weak volume. If price rises but volume is low, the move may be less reliable. If price falls sharply with heavy volume, sellers may be more aggressive.
In crypto technical analysis, volume can be especially important because markets can move quickly and liquidity can vary across assets. AI can help monitor volume changes in real time and flag unusual activity that may deserve closer attention.
Market Trends
A market trend describes the general direction of price movement. A market may be trending upward, trending downward, or moving sideways.
An uptrend usually forms when price makes higher highs and higher lows. A downtrend usually forms when price makes lower highs and lower lows. A sideways market occurs when price moves within a range without clear direction.
AI can help identify market trends by analyzing price structure, moving averages, momentum indicators, and volatility. OCT24 can support this process by helping traders evaluate whether a potential setup aligns with the broader trend or conflicts with it.
Support and Resistance
Support is a price area where buying interest may appear. Resistance is a price area where selling pressure may appear.
For example, if Ethereum repeatedly bounces near $3,000, traders may view that level as support. If it repeatedly struggles near $3,300, that level may become resistance.
Support and resistance are not perfect lines. They are better understood as zones. Price may move slightly above or below a level before reversing, especially during periods of Market Volatility.
AI can help detect repeated reactions around certain price areas and highlight zones where traders may want to pay attention. However, a support or resistance level should not be treated as guaranteed. It is a reference point, not a promise.
Indicators
Technical indicators are calculations based on market data such as price, volume, or volatility. They help traders interpret market conditions more quickly.
Common indicators include moving averages, RSI, MACD, Bollinger Bands, and volume-based tools. These indicators can help traders evaluate trend direction, momentum, overbought or oversold conditions, and volatility changes.
AI trading indicators can be useful because AI can compare multiple indicators at once. For example, it can review whether moving averages suggest an uptrend, whether RSI shows momentum cooling, and whether volume confirms a potential move.
This is where readers who have studied Best Indicators for AI Trading can begin connecting individual tools to a broader AI-powered workflow.
Chart Patterns
Chart patterns are recurring formations that traders use to understand possible market behavior. Examples include breakouts, pullbacks, reversals, consolidation zones, and trend continuations.
A chart pattern does not guarantee what happens next. It simply helps traders organize what they are seeing. AI can help recognize these patterns more quickly, especially across multiple markets, but traders still need to confirm whether the setup fits their risk plan.
For beginners still learning How to Read Crypto Charts, this is an important point. AI can speed up analysis, but traders benefit from understanding the chart logic behind the signal.
Technical analysis becomes more useful when these elements are combined. Price action, volume, trends, support and resistance, indicators, and chart patterns all provide different pieces of the same puzzle.
OCT24 helps traders approach that puzzle with more structure by using AI-powered tools to support market analysis, trading signals, and risk-aware decision-making.
How AI Uses Technical Analysis
AI uses technical analysis by processing market data, identifying patterns, comparing indicators, and evaluating market conditions faster than a trader could manually. Instead of looking at one chart at a time, AI can scan multiple assets, timeframes, and data points continuously.
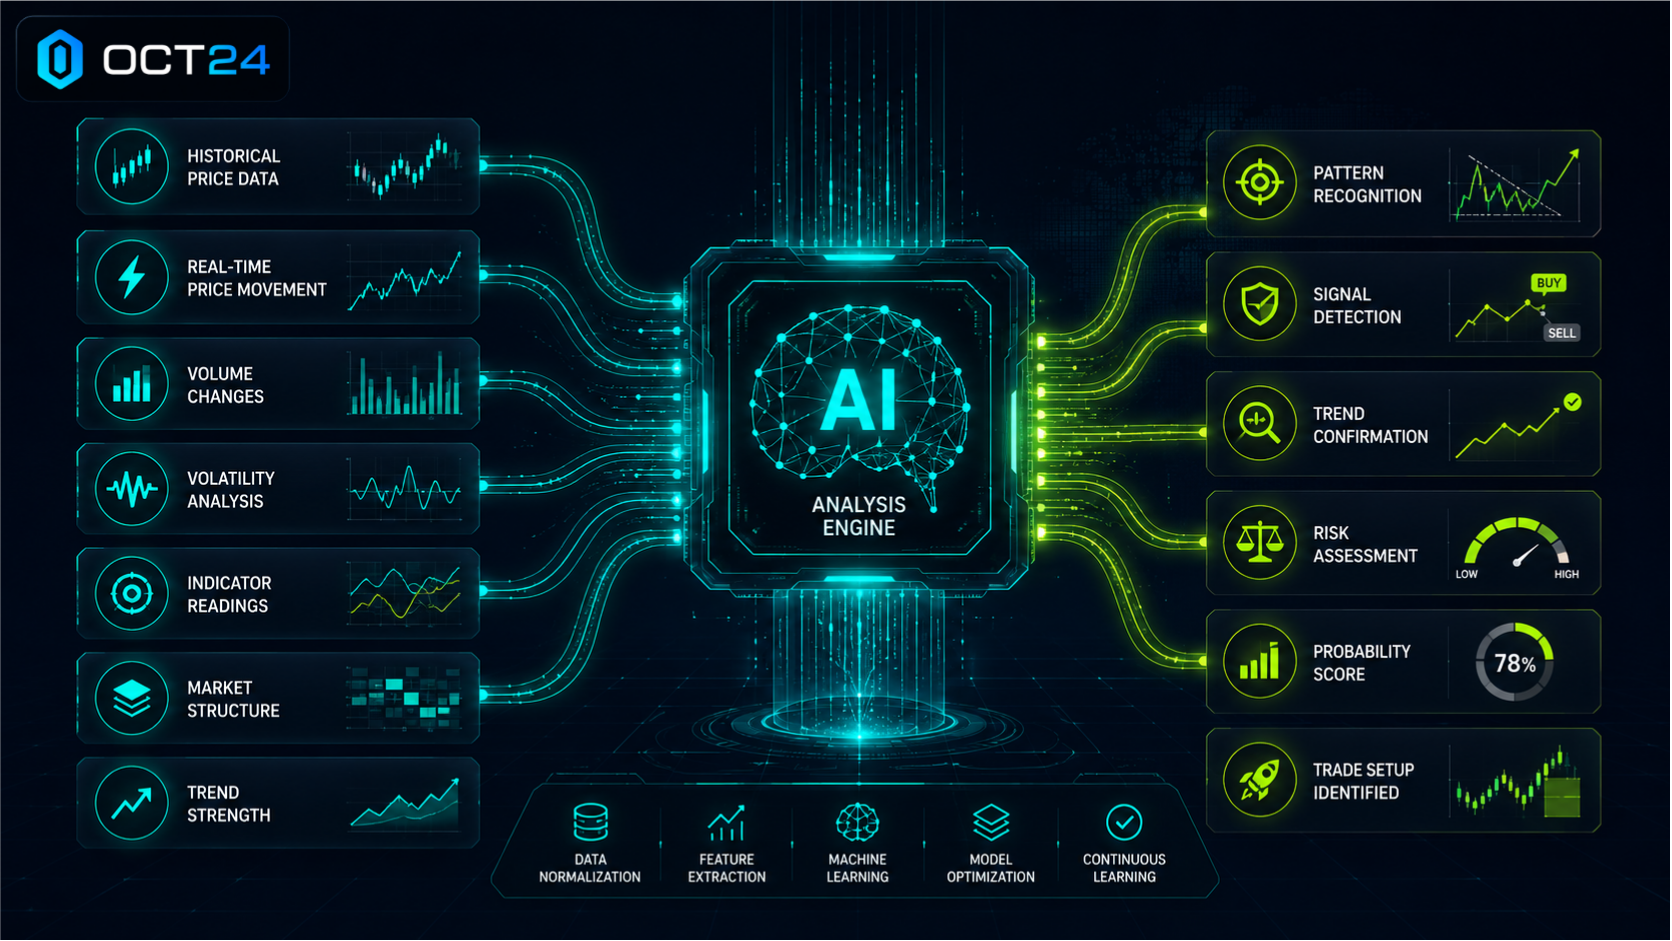
This matters because active trading often depends on speed and consistency. A trader may miss a setup because they were watching another chart. They may overlook volume. They may react emotionally after a sudden price move. AI can help reduce these gaps by reviewing data systematically.
However, AI does not “know” the future. It evaluates probabilities based on available information. A strong technical setup can still fail if conditions change quickly.
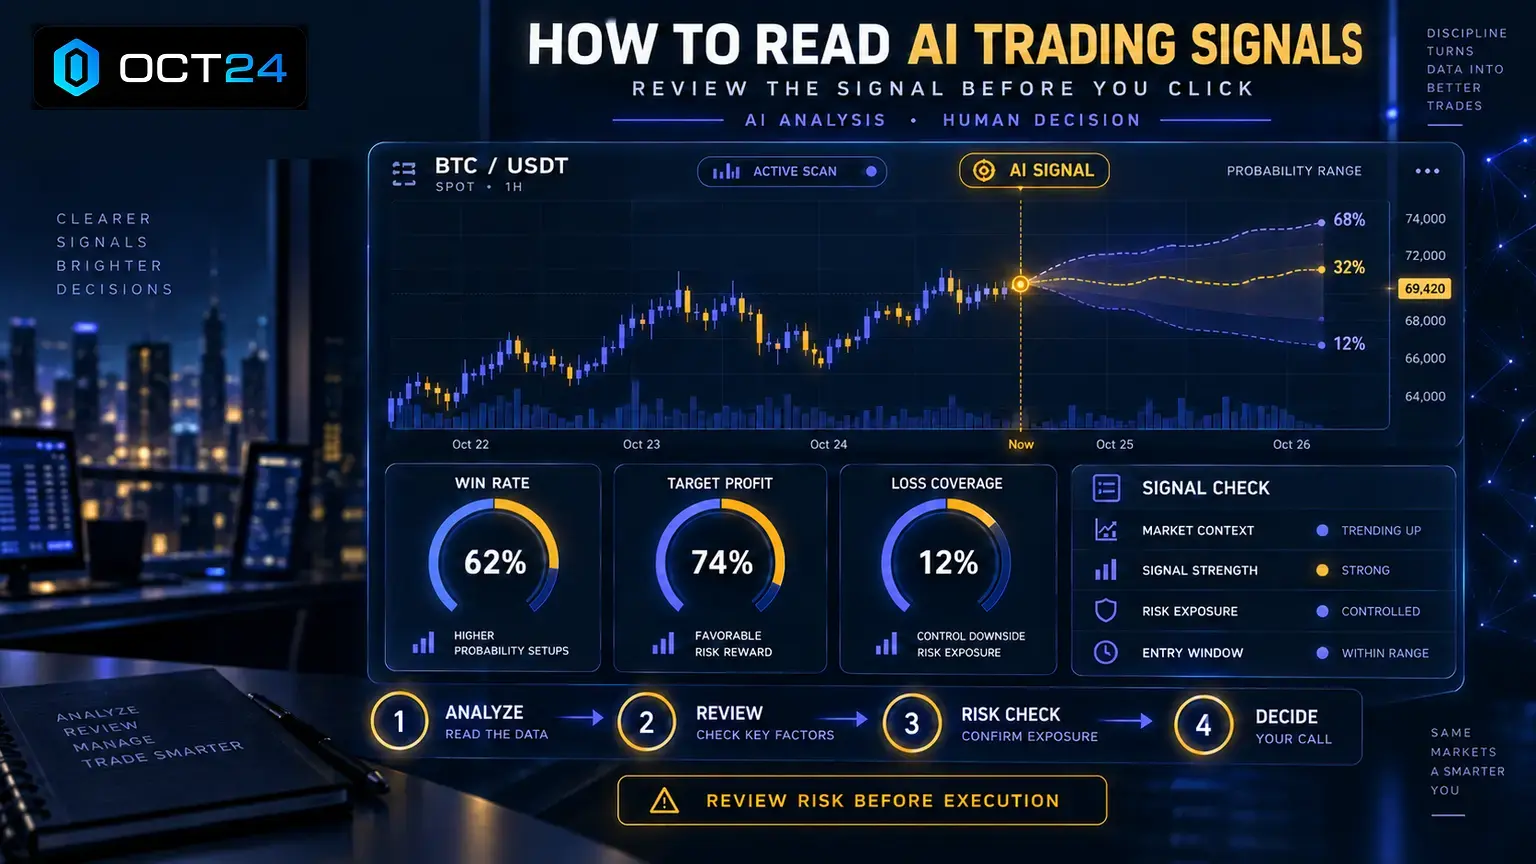
OCT24 is designed to help traders use AI Technical Analysis in a more structured workflow. The purpose is not to blindly follow every signal. The purpose is to help traders review market data, evaluate technical setups, and consider risk before acting.
For traders building AI Trading Strategies, this distinction matters. AI can help identify potential opportunities, but the strategy still defines when to enter, when to exit, how much to risk, and when to avoid trading.
Historical Price Data
Historical price data shows how an asset has moved in the past. AI can use this data to identify recurring patterns, trend behavior, volatility ranges, and previous support or resistance zones.
For example, if a crypto asset has repeatedly reversed near a certain price level, AI may identify that area as important. If price often accelerates after breaking above a certain range, AI may flag similar conditions in the future.
Historical data is useful, but it has limits. Markets change. A pattern that worked before may not work again. That is why AI should combine historical analysis with current market conditions.
Real-Time Price Movement
Real-time price movement shows what is happening now. For active traders, this is critical because markets can shift quickly.
AI can monitor real-time price behavior and detect changes that might be difficult to spot manually. It may identify sudden breakouts, sharp reversals, momentum changes, or abnormal price movement.
For example, if price moves above resistance while volume increases and momentum indicators strengthen, AI may identify a potential breakout setup. A trader can then review whether the trade fits their plan, stop-loss level, and risk tolerance.
This is also where AI Trading Signals become relevant. A trading signal may be generated when several technical conditions align, but that signal should still be reviewed before action is taken.
Volume Changes
Volume can confirm or weaken a technical signal. AI can compare current volume against recent averages to identify whether a move has meaningful participation.
A price breakout with low volume may suggest weak conviction. A breakout with rising volume may suggest stronger interest. Likewise, declining volume during a pullback may suggest that sellers are losing momentum.
OCT24 can help traders review volume as part of a broader signal review process. Instead of looking only at price direction, traders can evaluate whether market participation supports the setup.
Volatility
Volatility measures how much and how quickly price moves. High volatility can create opportunity, but it also increases risk.
AI can track volatility changes and help traders understand whether market conditions are calm, expanding, or unstable. This matters because the same strategy may behave differently in different volatility environments.
For example, a breakout strategy may perform better when volatility expands after a period of consolidation. A tight stop-loss may be more vulnerable during high-volatility conditions because price can move sharply before reversing.
AI can help identify volatility, but traders still need to manage position size and stop-loss placement carefully.
Indicator Readings
AI can analyze multiple indicators at once and compare their signals. This can help traders avoid relying on one indicator in isolation.
For example, a moving average may suggest the market is trending upward. RSI may show that momentum is strong but not yet overextended. Volume may confirm increasing participation. Together, these readings may support a stronger technical case than any one indicator alone.
This does not mean the trade is guaranteed. It simply means the setup has more technical alignment.
One of the Common AI Trading Mistakes is assuming that indicator alignment equals certainty. In reality, alignment should be treated as a reason to investigate a setup further, not as a guarantee that the trade will succeed.
Market Structure
Market structure refers to how price is forming highs, lows, ranges, and trend behavior.
AI can review whether price is making higher highs and higher lows, lower highs and lower lows, or moving sideways. This helps traders understand whether the market is trending, reversing, or consolidating.
Market structure is important because it gives context to indicators. A bullish RSI reading in a strong uptrend may mean something different from a bullish RSI reading in a choppy sideways market.
Trend Strength
Trend strength measures how strong or weak a market move appears to be. AI can evaluate trend strength by looking at price direction, moving averages, momentum, volume, and volatility together.
A strong trend may show consistent higher highs, strong volume, and price holding above key moving averages. A weak trend may show choppy movement, fading volume, and repeated failed breakouts.
For OCT24 users, this kind of structured trend review can help separate higher-quality setups from noisy market movement. The goal is not to trade every signal. The goal is to understand which signals deserve closer review.
Key Technical Indicators AI Can Analyze
Technical indicators help traders simplify market data. AI can analyze these indicators quickly and compare them across assets, timeframes, and market conditions.
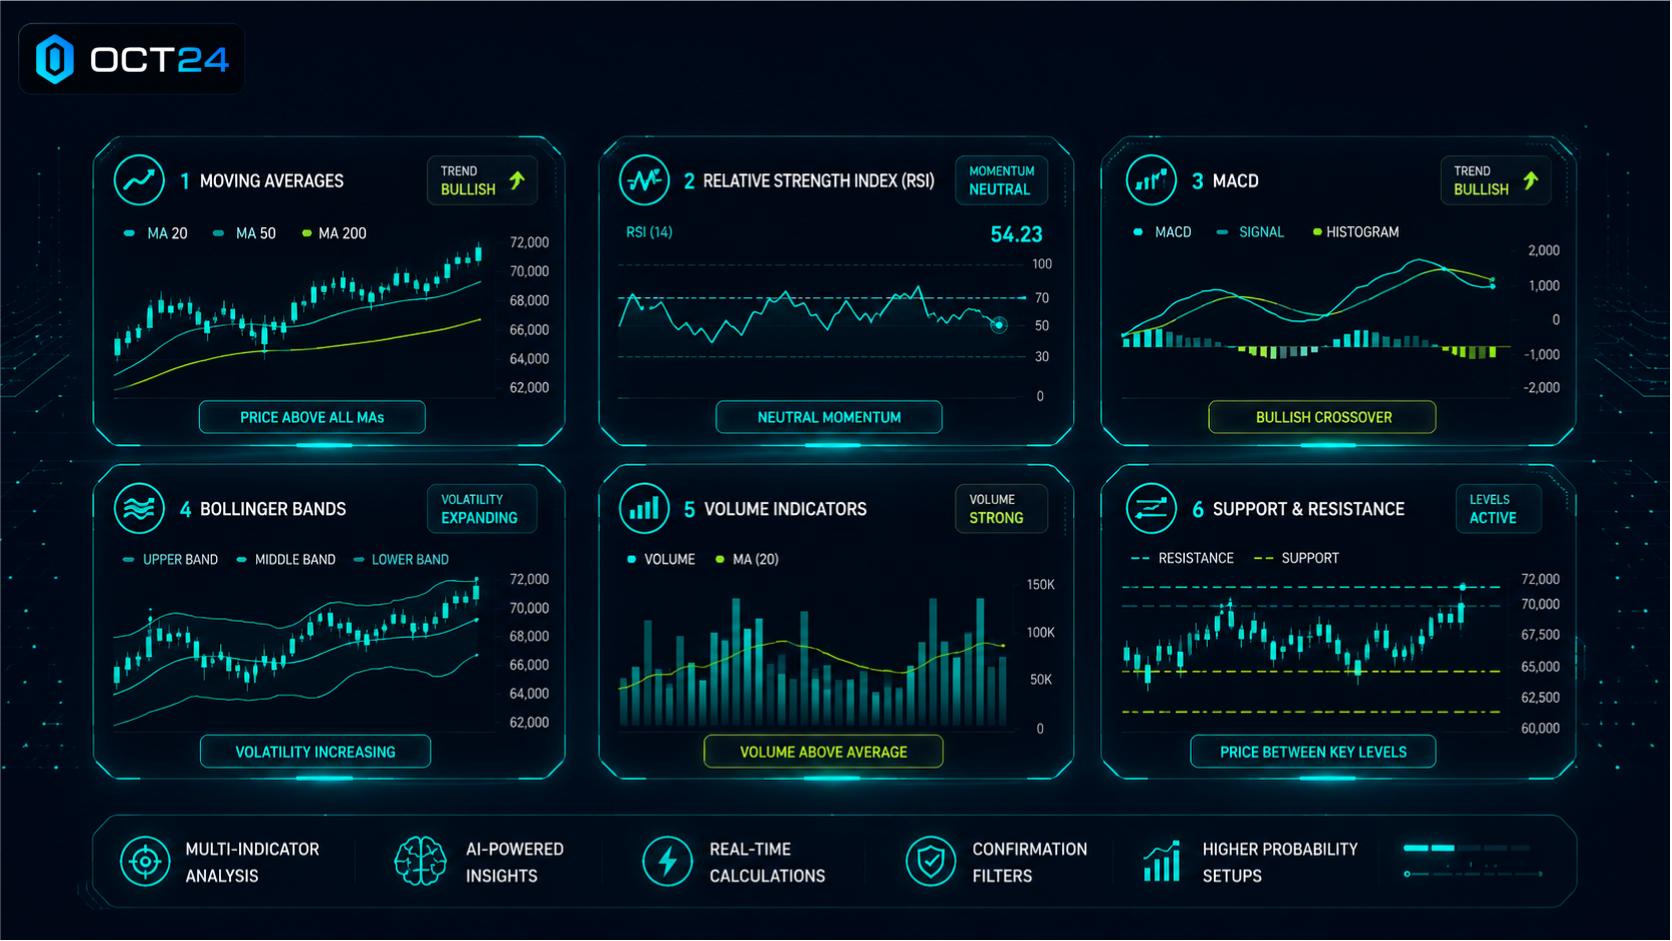
The Best Indicators for AI Trading are not necessarily the most complicated ones. For many beginner and intermediate traders, the most useful indicators are the ones that clearly measure trend, momentum, volatility, volume, and key price levels.
A practical rule is to avoid indicator overload. More indicators do not always mean better decisions. In many cases, too many indicators create confusion and conflicting signals.
OCT24 can help traders evaluate indicators as part of a broader trading workflow, where technical signals are reviewed alongside risk, market context, and strategy fit.
Moving Averages
A moving average smooths out price data to show the average price over a selected period. Traders use moving averages to identify trend direction and potential support or resistance areas.
For example, if price stays above a 50-period moving average, traders may view the market as trending upward. If price falls below that moving average and fails to recover, it may suggest weakening momentum.
AI can interpret moving averages by looking at:
- Whether price is above or below the moving average
- Whether short-term moving averages are crossing above or below longer-term averages
- Whether moving averages are sloping upward, downward, or flattening
- Whether price is pulling back toward a moving average during a trend
A moving average should not be used alone. Price can move above or below a moving average temporarily, especially in choppy markets. AI can help reduce false interpretation by comparing the moving average with trend strength, volume, and volatility.
Relative Strength Index, or RSI
The Relative Strength Index, or RSI, is a momentum indicator that helps traders evaluate whether an asset may be overbought or oversold. RSI usually moves between 0 and 100.
Many traders view RSI above 70 as potentially overbought and RSI below 30 as potentially oversold. However, those levels are not automatic buy or sell signals.
In a strong uptrend, RSI can stay elevated for a long time. In a strong downtrend, RSI can remain weak. That is why RSI works best when interpreted with market context.
AI can analyze RSI by reviewing:
- Whether momentum is strengthening or weakening
- Whether RSI is approaching overbought or oversold zones
- Whether RSI is diverging from price
- Whether RSI behavior matches the broader trend
For example, if price makes a new high but RSI fails to make a new high, that may suggest momentum is weakening. AI can flag this type of divergence, but traders should still confirm the setup before acting.
MACD
MACD stands for Moving Average Convergence Divergence. It is a momentum and trend-following indicator that helps traders evaluate changes in trend strength.
MACD usually includes a MACD line, a signal line, and a histogram. Traders often watch for crossovers, changes in histogram direction, and whether momentum is increasing or fading.
AI can analyze MACD by identifying:
- Bullish or bearish crossovers
- Momentum shifts
- Changes in histogram strength
- Alignment with price trend
- Divergence between price and momentum
For example, if price is trending upward and MACD momentum begins strengthening again after a pullback, AI may identify a possible continuation setup.
MACD can produce false signals in sideways markets. That is why AI should evaluate MACD alongside market structure, volume, and support or resistance zones.
Bollinger Bands
Bollinger Bands help traders understand volatility and price movement around an average. They typically include a middle moving average and two outer bands that expand or contract based on volatility.
When bands widen, volatility is increasing. When bands narrow, volatility is decreasing. Traders may use Bollinger Bands to identify breakouts, reversals, or periods of consolidation.
AI can interpret Bollinger Bands by reviewing:
- Whether price is near the upper or lower band
- Whether bands are expanding or contracting
- Whether price is breaking out after a squeeze
- Whether volatility supports the trading setup
For example, if Bollinger Bands narrow for a period and price then breaks above resistance with rising volume, AI may flag a potential breakout. The trader still needs to consider risk, stop-loss placement, and whether the move has enough confirmation.
Volume Indicators
Volume indicators help traders understand participation behind a price move. Price movement with strong volume may carry more weight than movement with weak volume.
AI can compare current volume with historical averages and detect unusual spikes. It can also analyze whether volume supports or contradicts price action.
For example, if price breaks above resistance but volume remains low, AI may classify the signal as weaker. If price breaks above resistance with strong volume, the setup may appear more convincing.
Volume is especially important in crypto technical analysis because liquidity can vary across tokens and exchanges. A move in a low-volume asset may be more vulnerable to sudden reversals.
Support and Resistance Levels
Support and resistance levels help traders identify areas where price has reacted before. These levels can influence entries, exits, stop-loss placement, and risk-to-reward planning.
AI can detect support and resistance by reviewing repeated price reactions, previous highs and lows, volume clusters, and consolidation zones.
For example, if price has failed three times near the same level, AI may identify that area as resistance. If price later breaks above that zone with strong volume, it may flag a potential breakout.
Support and resistance should not be treated as exact numbers. They are better understood as zones where traders may expect reactions. OCT24 can help traders review these zones alongside trading signals and broader market trends, making the technical analysis process more practical and disciplined.
Practical Takeaway
AI trading indicators are most useful when they work together. A moving average may show trend direction. RSI may show momentum. MACD may show a shift in trend strength. Bollinger Bands may show volatility. Volume may confirm participation. Support and resistance may define key price zones.
Used together, these tools can help traders build a more complete technical view.
Used carelessly, they can create confusion.
That is why AI Technical Analysis should be treated as a decision-support process, not a shortcut. OCT24 helps traders use technical analysis in a more structured way by supporting faster data review, clearer signal interpretation, and more risk-aware trading decisions.
How AI Identifies Chart Patterns
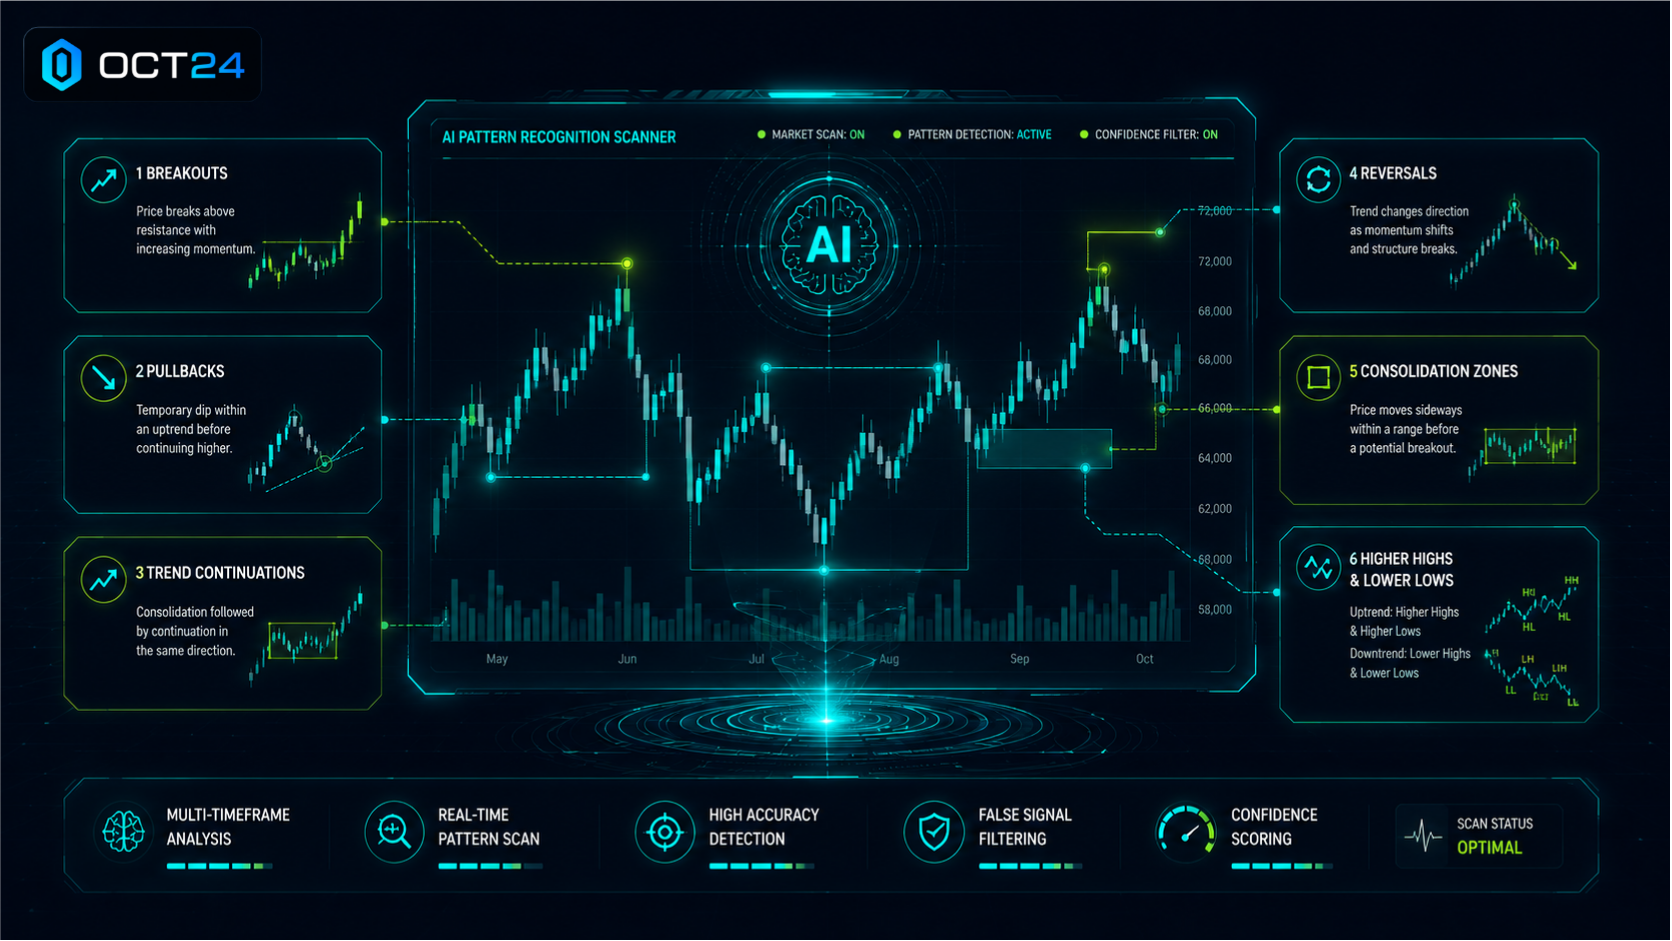
AI identifies chart patterns by scanning price behavior, comparing current movement with historical structures, and looking for repeatable formations that may signal a potential trading opportunity. Instead of manually checking one chart at a time, AI can review many assets, timeframes, and technical conditions at once.
Chart patterns are useful because they help traders organize market behavior. They do not guarantee what price will do next, but they can show where buyers and sellers may be reacting.
In OCT24, AI-powered tools can help traders review patterns alongside risk conditions, market trends, and AI Trading Signals. This matters because a chart pattern alone is rarely enough. Traders still need to ask whether the setup fits the broader market context and their personal risk plan.
Breakouts
A breakout happens when price moves beyond a key support or resistance zone. For example, if a crypto asset has struggled to move above $2,500 several times and then finally pushes above that level with stronger volume, traders may view it as a breakout.
AI can help identify breakouts by reviewing:
- Previous resistance or support zones
- Price movement near those levels
- Volume confirmation
- Volatility expansion
- Trend strength before and after the breakout
However, breakouts can fail. A false breakout happens when price moves above resistance or below support, then quickly reverses. This is why AI Technical Analysis should treat breakouts as setups to review, not automatic trade instructions.
Pullbacks
A pullback is a temporary move against the main trend. In an uptrend, price may rise, pause, and dip before continuing higher. In a downtrend, price may fall, bounce, and then continue lower.
Pullbacks are important because they can give traders a more controlled entry point. Instead of chasing a move after price has already surged, a trader may wait for price to return toward a moving average, support zone, or previous breakout level.
AI can help identify pullbacks by checking whether the broader trend is still intact. For example, if price pulls back but remains above a key moving average, volume stays controlled, and momentum begins to recover, AI may flag a possible continuation setup.
OCT24 can help traders evaluate this type of setup more clearly by combining pattern recognition with structured signal review and risk-aware decision-making.
Trend Continuations
A trend continuation pattern suggests that the existing trend may continue after a pause or consolidation. These setups often appear when price moves strongly, slows down, and then begins to move in the same direction again.
For example, if an asset is in an uptrend and forms a short consolidation zone before breaking higher, traders may see that as a continuation pattern.
AI can analyze trend continuations by reviewing higher highs, higher lows, moving average direction, momentum indicators, and volume behavior. The goal is to determine whether the trend still has strength or whether it may be weakening.
This is also where Automated Trading can support active traders. Automation can help monitor technical conditions continuously, but it should still be guided by clear rules, confirmation criteria, and risk limits.
Reversals
A reversal happens when price shifts from one direction to another. An uptrend may begin turning into a downtrend, or a downtrend may begin turning into an uptrend.
Reversals can be difficult for beginners because early reversal signs can look similar to normal pullbacks. For example, a small drop in an uptrend does not always mean the trend is over. It may simply be a temporary pause.
AI can help by comparing multiple signs at once, such as weakening momentum, failed breakout attempts, lower highs, volume changes, and price breaking below support. Still, traders should be careful. Reversal trading can be risky because it often means trading against the previous trend.
Consolidation Zones
A consolidation zone forms when price moves sideways within a range. Buyers and sellers are active, but neither side has clear control.
Consolidation can happen before a breakout, after a strong trend, or during uncertain market conditions. AI can detect consolidation by analyzing narrowing price ranges, reduced volatility, and repeated reactions around support and resistance.
This is useful because consolidation often prepares the market for a larger move. But direction is not always obvious. A trader should wait for confirmation rather than assuming price will break in one direction.
Higher Highs and Lower Lows
Higher highs and higher lows often suggest an uptrend. Lower highs and lower lows often suggest a downtrend.
AI can track these structures across different timeframes. For example, a short-term chart may show a possible breakout, but a higher timeframe may still show a downtrend. That context matters.
OCT24’s AI-assisted workflow can help traders avoid looking at one pattern in isolation. A pattern is more useful when it is reviewed with trend strength, volatility, risk-to-reward, and broader market context.
How AI Turns Technical Analysis Into Trading Signals
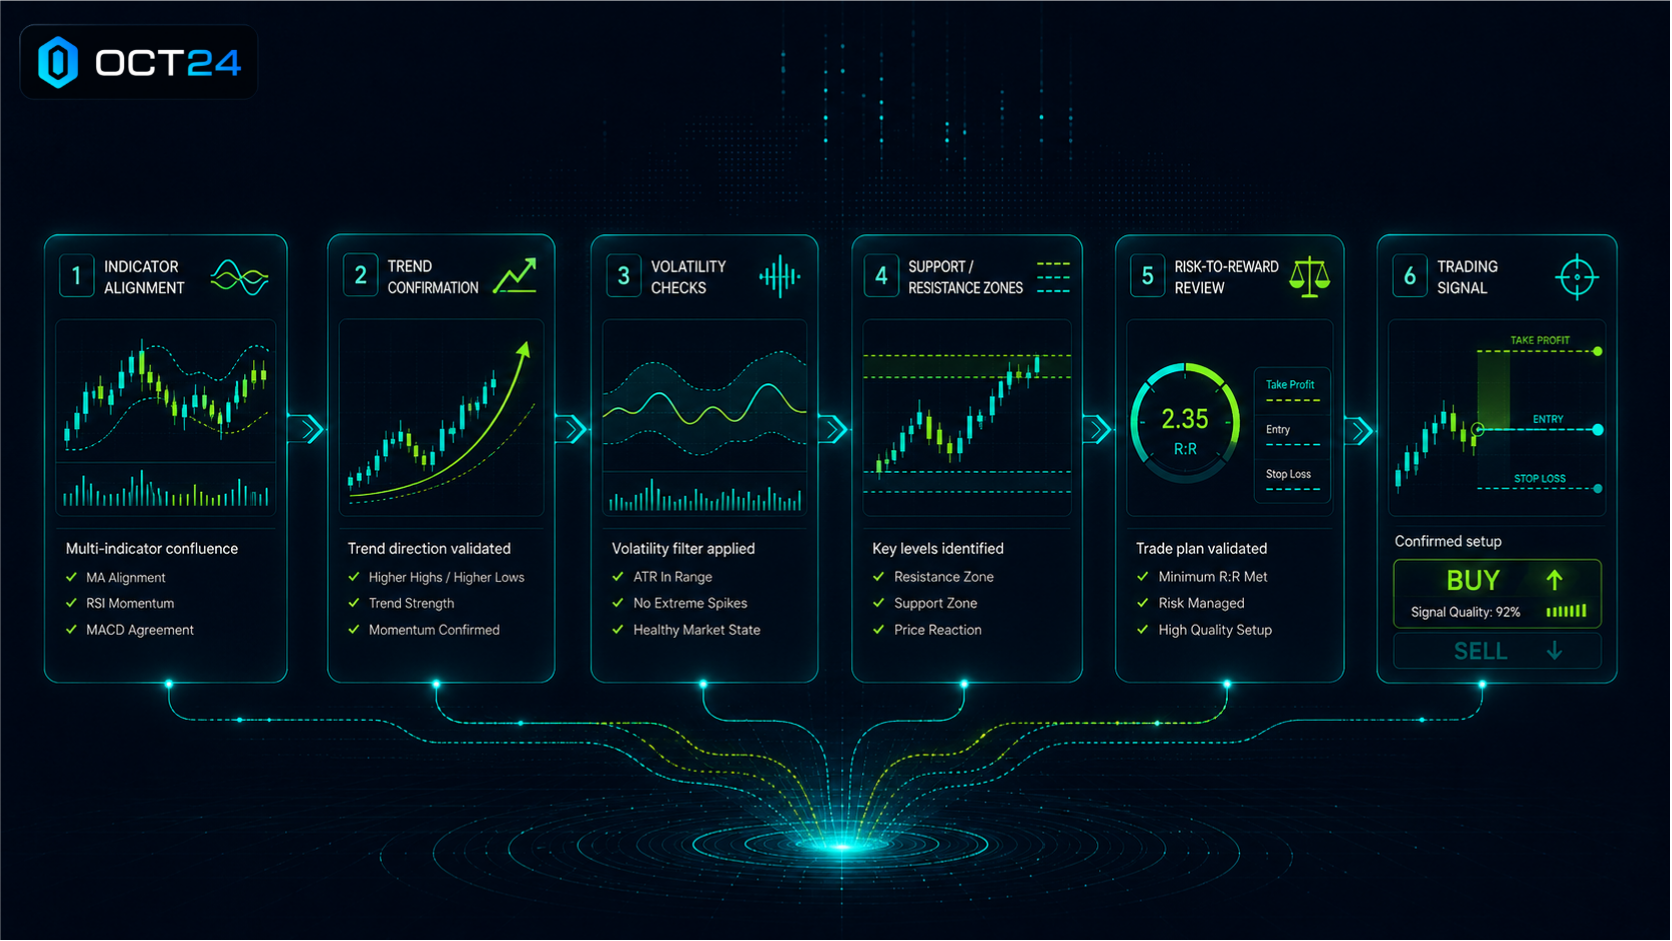
AI turns technical analysis into trading signals by combining multiple technical conditions and identifying when they align. A signal may be based on trend direction, indicator readings, price patterns, volatility, support and resistance, and risk-to-reward conditions.
A trading signal should be treated as decision support, not a command to trade.
This connects directly to one of the most common AI trading mistakes: blindly following signals without reviewing the setup. AI can help identify opportunities, but the trader still needs to consider risk controls, market conditions, and whether the signal fits their AI trading strategy.
Indicator Alignment
Indicator alignment happens when several indicators point in the same general direction.
For example, price may be above a moving average, RSI may show improving momentum, MACD may confirm a bullish shift, and volume may increase as price approaches resistance. Together, these conditions may create a stronger technical case than any one indicator alone.
AI can scan for this type of alignment quickly. But alignment does not guarantee success. It simply suggests that several technical factors are supporting the same interpretation.
This is one of the Benefits of AI Trading: AI can compare multiple data points more efficiently than manual chart review. The benefit is strongest when traders use that information as part of a structured decision-making process.
Trend Confirmation
Trend confirmation helps determine whether a trade idea matches the broader direction of the market.
For example, a buy signal may be stronger if the market is already in an uptrend. A sell signal may be stronger if the market is already making lower highs and lower lows.
AI can review trend confirmation across multiple timeframes. This helps traders avoid taking trades that may look good on a short-term chart but conflict with the bigger market structure.
Volatility Checks
Market Volatility can change how a signal should be interpreted. High volatility can create larger opportunities, but it can also increase the chance of sudden reversals.
AI can measure volatility conditions before identifying or ranking a signal. For example, if volatility is unusually high, the system may flag that wider stop-losses, smaller position sizes, or extra confirmation may be needed.
OCT24 supports structured signal review by helping traders consider these conditions before acting. A signal is stronger when traders understand the environment around it.
Support and Resistance Zones
AI can use support and resistance zones to help evaluate where price may react.
For example, a buy signal near a support zone may be more relevant than a buy signal in the middle of a random range. A breakout above resistance may become more meaningful if volume increases and the broader trend supports the move.
Support and resistance can also help traders think about stop-loss placement and possible profit targets. This is where Risk Management Strategies become part of technical analysis.
Risk-to-Reward Considerations
A technical setup is not useful if the risk is too large compared with the potential reward.
For example, suppose AI identifies a breakout opportunity. If the logical stop-loss is far below the entry and the nearest resistance level is close above, the trade may offer poor risk-to-reward. Even if the signal looks technically strong, the trade may not be worth taking.
Good AI Technical Analysis does not only ask, “Is there a signal?” It also asks, “Is this signal worth the risk?”
Market Conditions
Market conditions affect how trading signals perform. A trend-following signal may work better in a trending market than in a sideways market. A breakout signal may be stronger when volatility is expanding after consolidation. A reversal signal may need more confirmation when the broader trend remains strong.
OCT24 helps traders use AI insights in a more structured way by encouraging signal review within a broader trading workflow. Instead of reacting to every alert, traders can review whether the signal fits their strategy, risk limits, and market environment.
Technical Analysis vs Market Context
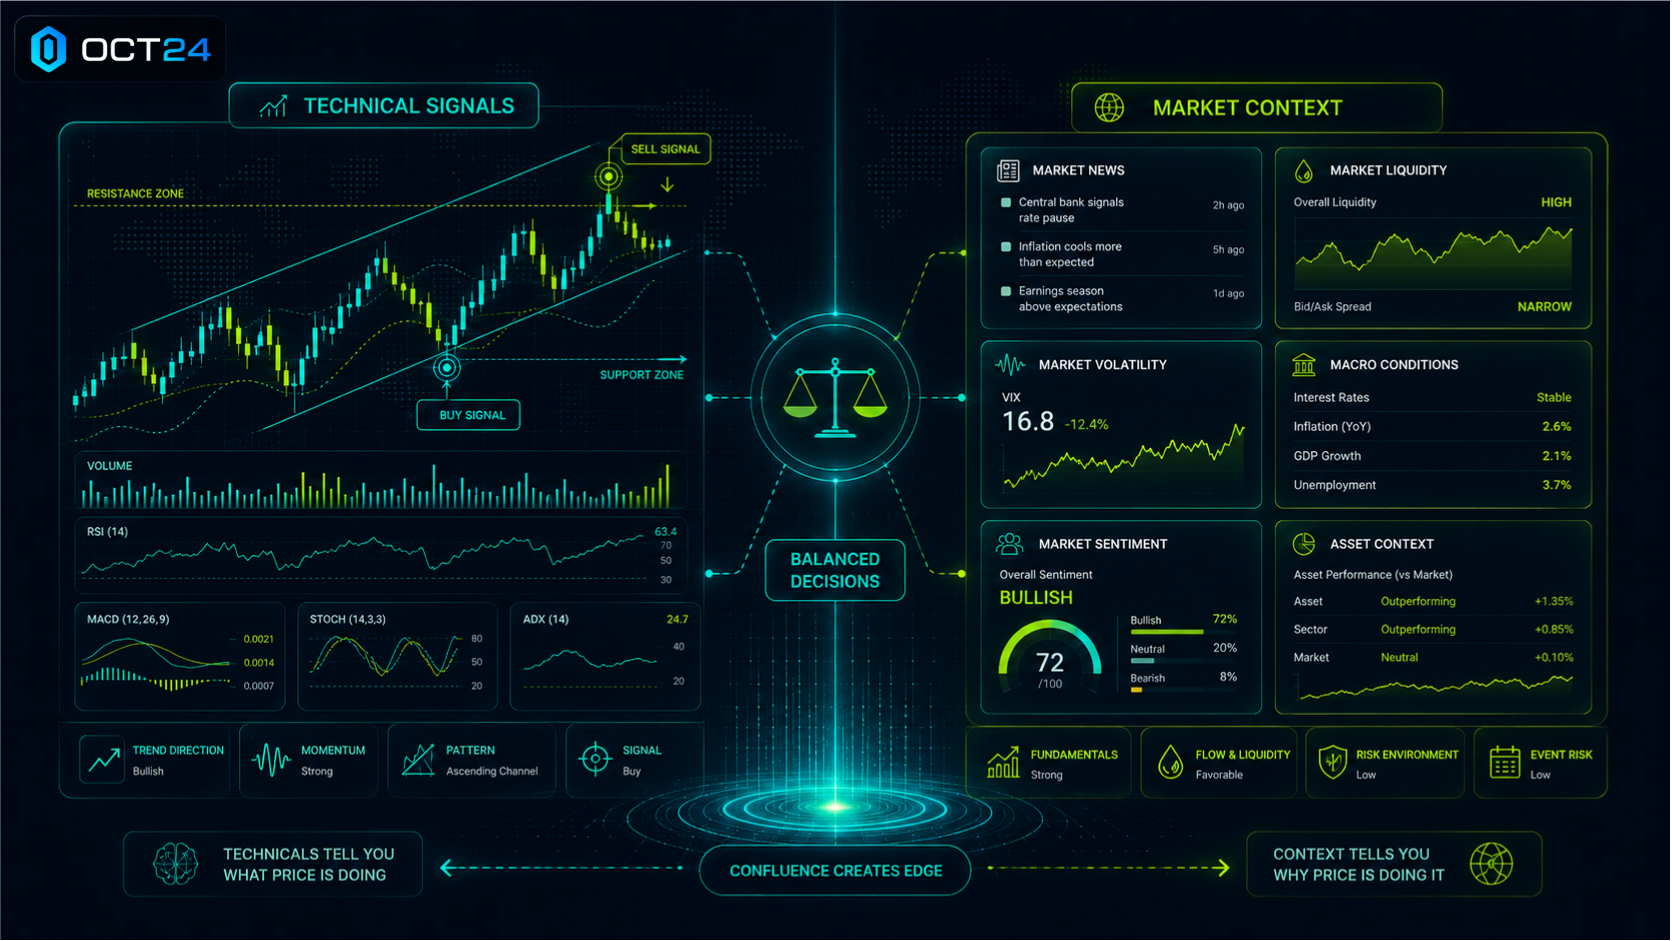
Technical analysis should not be used in isolation. It shows what price, volume, and indicators are doing, but it does not always explain why the market is moving.
A chart can look bullish seconds before unexpected news changes the entire market. A support level can fail if liquidity disappears. A breakout can reverse if broader sentiment shifts.
This is why responsible traders combine technical analysis with market context.
News Events
News can quickly change technical conditions. Regulatory updates, exchange announcements, economic data, central bank comments, security incidents, and major institutional activity can all affect price.
AI can scan technical conditions, but traders should still be aware of major news events that could create sudden volatility. A technical setup may be less reliable if a major announcement is expected.
Liquidity
Liquidity refers to how easily an asset can be bought or sold without causing large price movement. Low-liquidity assets may move sharply on relatively small trades.
In crypto technical analysis, liquidity matters because some assets have thinner order books than others. A chart pattern may look attractive, but if liquidity is weak, entries and exits may be harder to manage.
Market Volatility
Market Volatility affects trade timing, stop-loss placement, and position sizing. During calm markets, price may move slowly and signals may develop gradually. During highly volatile markets, price can move quickly through support or resistance.
AI can detect volatility changes, but traders still need to adjust risk. OCT24 can support this by helping traders review risk conditions alongside technical signals rather than treating all setups the same.
Macroeconomic Conditions
Macroeconomic conditions can influence trader behavior across markets. Interest rates, inflation data, currency strength, and risk appetite can affect both crypto and traditional financial assets.
Technical analysis may show a potential setup, but macro conditions can influence whether traders are willing to take risk. This is especially important during periods of broad market uncertainty.
Overall Market Sentiment
Market sentiment reflects how traders feel about risk. In a strong risk-on environment, bullish signals may have more follow-through. In a risk-off environment, traders may sell rallies more aggressively.
AI can help identify shifts in sentiment through price behavior, volume, and trend strength, but human judgment is still useful when interpreting the broader environment.
Asset-Specific Behavior
Every asset behaves differently. Some crypto assets trend smoothly, while others move in sharp bursts. Some respond strongly to technical levels, while others are more influenced by news, liquidity, or community activity.
A responsible AI trading strategy should account for these differences. OCT24 supports a more complete workflow by helping traders evaluate market behavior, technical setups, and risk conditions together.
Common Technical Analysis Mistakes Beginners Make
Technical analysis can be useful, but beginners often misuse it. These mistakes are different from general AI trading errors because they are specifically about reading charts, indicators, and signals incorrectly.
Using Too Many Indicators
More indicators do not always create better analysis. In many cases, they create confusion.
A beginner may add moving averages, RSI, MACD, Bollinger Bands, stochastic indicators, volume tools, and several custom signals to one chart. The result is often mixed signals and decision fatigue.
A better approach is to use a small set of indicators that each serve a clear purpose. For example, one trend indicator, one momentum indicator, and one volume tool may be easier to interpret than ten overlapping indicators.
Relying on One Indicator
The opposite mistake is relying on one indicator too heavily.
For example, a trader may buy every time RSI falls below 30 because they assume the asset is oversold. But in a strong downtrend, RSI can remain weak while price continues falling.
AI trading indicators work best when combined with price action, volume, trend structure, and risk management. No single indicator should control the entire decision.
Ignoring Volume
Volume helps confirm whether a price move has real participation. Ignoring volume can make traders overestimate weak moves.
For example, price may break above resistance, but if volume is low, the breakout may lack strength. AI can help flag volume confirmation, but traders should understand why it matters.
Trading Every Signal
Not every signal deserves action. Some signals appear in poor market conditions. Some have weak confirmation. Some offer poor risk-to-reward.
OCT24 can help traders build a more structured approach to reviewing AI Trading Signals, but discipline still matters. A trader should be willing to skip a trade when the setup is unclear.
Misreading Chart Patterns
Beginners often see patterns where none exist. A normal pullback may look like a reversal. A sideways range may look like a breakout setup. A random price move may be mistaken for a trend continuation.
AI can help identify chart patterns more consistently, but traders still need confirmation. Pattern recognition should be paired with volume, trend direction, support and resistance, and market context.
Ignoring Stop-Losses
Technical analysis can help traders choose more logical stop-loss areas, but beginners often ignore them. They may enter a trade based on a chart setup without deciding where the setup becomes invalid.
A stop-loss is not just a risk tool. It is part of the technical plan. If the reason for entering the trade is no longer valid, the trader needs a predefined exit.
Forgetting Risk Management
Even accurate analysis can lead to poor outcomes if risk is too high. A trader can identify a good setup and still lose too much because position size is too large.
This is where Trading Bot Risk Management and broader Risk Management Strategies matter. AI can assist with analysis, but traders still need rules for exposure, position sizing, stop-loss placement, and drawdown limits.
Assuming Technical Analysis Predicts the Future
Technical analysis does not predict the future with certainty. It helps traders evaluate probabilities based on current and historical market behavior.
AI Technical Analysis can make this process faster and more consistent, but it does not eliminate risk. Traders should use technical analysis to prepare, not to assume they know what will happen next.
Practical Example: How AI Might Analyze a Trade Setup
Imagine a crypto asset has been trending upward for several days. Price is making higher highs and higher lows, and the asset remains above a key moving average.
Then price begins to pull back. A beginner might panic and assume the trend is over. But AI may analyze the situation differently.
First, AI reviews the trend. The broader structure still shows higher highs and higher lows, so the uptrend remains intact.
Second, AI checks the moving average. Price is pulling back toward it, but not breaking below it decisively. This may suggest a normal pullback rather than a full reversal.
Third, AI reviews RSI. RSI had previously been near overbought levels, but it has now cooled down. This can mean momentum is resetting rather than collapsing.
Fourth, AI checks volume. Selling volume during the pullback is moderate, not extreme. Then volume begins to increase again as price stabilizes near the moving average.
Fifth, AI reviews support and resistance. Price is holding near a previous breakout zone, which may now act as support.
At this point, AI may detect a possible continuation setup. But that does not mean the trader should automatically enter.
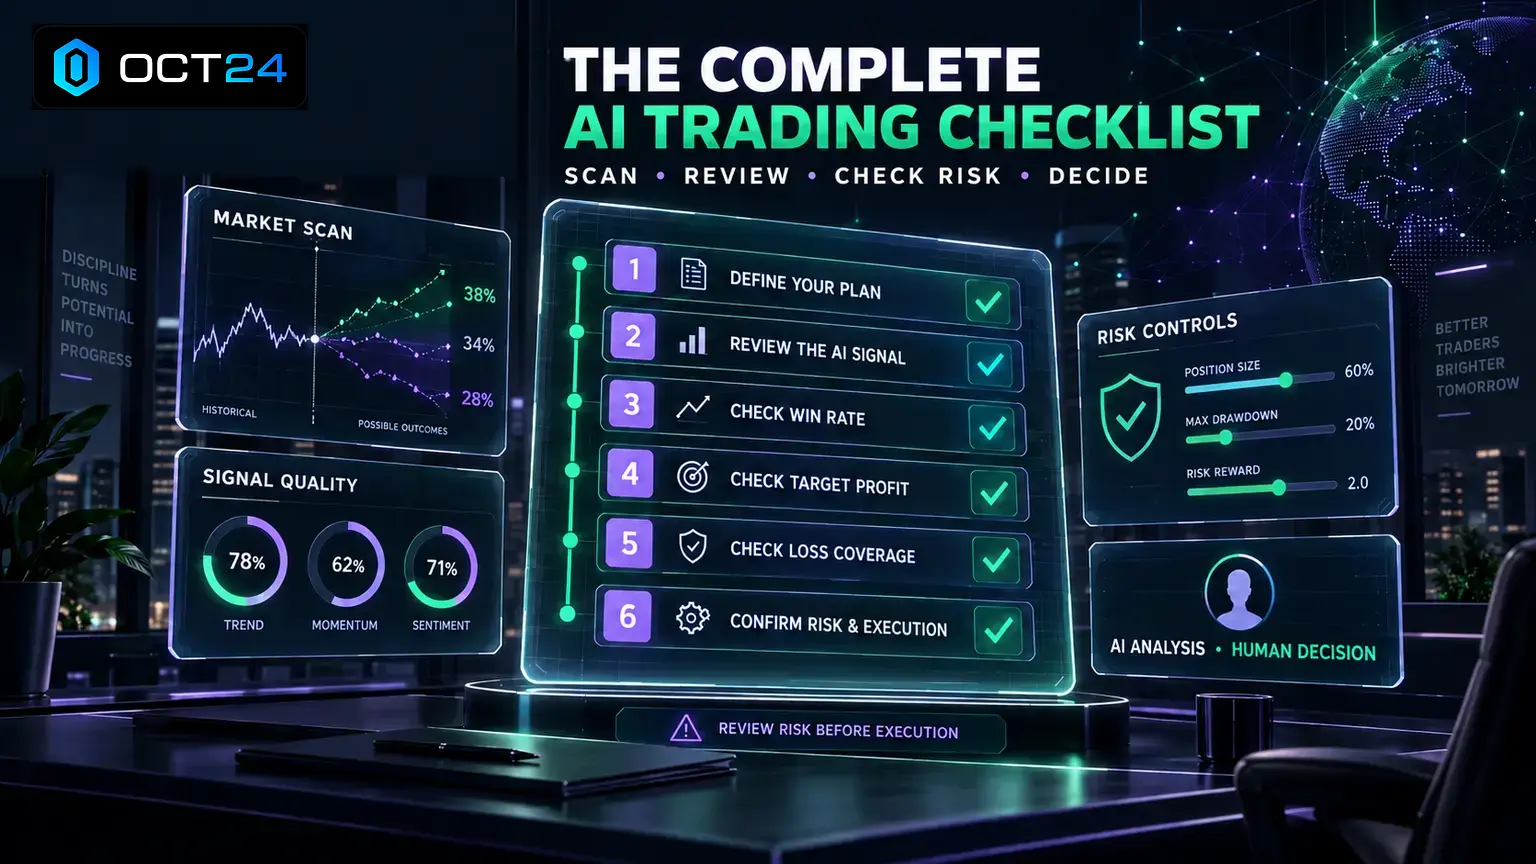
Using OCT24, a trader could review the setup, compare it with market conditions, check whether the signal fits their AI trading strategy, and define the risk before acting. They might ask:
- Where would this setup become invalid?
- Where should the stop-loss go?
- Is the potential reward worth the risk?
- Is volatility too high for the planned position size?
- Does this trade fit today’s trading plan?
If the answers are unclear, skipping the trade may be the best decision. AI can identify the opportunity, but the trader still needs discipline.
How OCT24 Uses AI Technical Analysis
OCT24 supports AI-assisted technical analysis by helping traders scan markets, review technical setups, evaluate trading signals, and approach execution with more structure.
The goal is not to replace trader judgment. The goal is to reduce manual chart analysis and help traders interpret market data more efficiently.
With OCT24, traders can use AI-powered tools to support a more organized workflow:
- Scan market conditions across multiple assets
- Identify potential technical setups
- Analyze trading signals
- Review market trends
- Evaluate volatility and risk conditions
- Support one-click trade execution
- Apply risk management tools
- Reduce repetitive manual analysis
The G6 Trading Bot is part of this broader OCT24 ecosystem. It is designed to help traders monitor market conditions, identify potential opportunities, and support faster analysis. But like any AI trading bot, it should be used with a clear plan, risk controls, and realistic expectations.
OCT24’s approach is especially useful for traders who want the benefits of AI trading without turning every signal into an automatic trade. The platform supports a more responsible process: review the signal, understand the technical setup, check the risk, and decide whether the opportunity fits the trading plan.
For readers who want to understand the company and platform behind the tools, the About OCT24 page can provide helpful context. Choosing a trading platform is not only about features; it is also about whether the platform supports disciplined, risk-aware decision-making.
OCT24 does not guarantee trading results. No platform can. But it can help traders use AI Technical Analysis in a more structured and practical way.
Frequently Asked Questions
What is AI Technical Analysis?
AI Technical Analysis is the use of artificial intelligence to analyze price action, volume, indicators, chart patterns, market trends, and volatility. It helps traders review technical data more efficiently and identify potential trading opportunities.
Can AI perform technical analysis better than humans?
AI can process more data faster than humans and can scan multiple markets continuously. However, humans still play an important role in strategy, risk management, and interpreting broader market context.
What indicators does AI use for trading?
AI can analyze many indicators, including moving averages, RSI, MACD, Bollinger Bands, volume indicators, and support and resistance levels. The Best Indicators for AI Trading are usually those that help measure trend, momentum, volatility, and market participation.
Can AI technical analysis predict the market?
No. AI Technical Analysis can identify probabilities and potential setups, but it cannot predict the market with certainty. Markets are influenced by news, liquidity, sentiment, volatility, and unexpected events.
Is technical analysis useful for crypto trading?
Yes, technical analysis can be useful for crypto trading because crypto markets often move quickly and are heavily influenced by price action, volume, momentum, and market sentiment. However, crypto technical analysis should always be paired with risk management.
How does AI create trading signals?
AI creates trading signals by analyzing technical conditions such as indicator alignment, trend confirmation, support and resistance zones, volatility, volume, and risk-to-reward potential. A signal should be treated as decision support, not an automatic instruction to trade.
Should beginners use AI trading indicators?
Beginners can use AI trading indicators, but they should start simple. It is better to understand a few useful indicators than to rely on too many signals at once. AI can help simplify analysis, but traders still need to learn what the indicators mean.
How does OCT24 use technical analysis?
OCT24 uses AI-powered tools to help traders scan markets, identify technical setups, analyze trading signals, review market trends, and support risk-aware decision-making. It helps traders use technical analysis in a more structured workflow.
Does technical analysis replace risk management?
No. Technical analysis helps traders evaluate possible opportunities, but risk management determines how much capital is at risk, where stop-losses may be placed, and whether a trade fits the overall plan.
Final Summary
AI Technical Analysis can help traders review charts, indicators, market trends, and trading signals faster than manual analysis alone. It can identify breakouts, pullbacks, trend continuations, reversals, consolidation zones, and changes in momentum across multiple markets.
But AI does not remove uncertainty. Technical analysis still works with probabilities, not guarantees. A signal may be useful, but it should always be reviewed alongside market context, volatility, liquidity, risk-to-reward, and the trader’s strategy.
For beginner and intermediate traders, the most important lesson is simple: use AI to improve the process, not to skip the process.
OCT24 helps traders apply AI-powered technical analysis in a more structured and responsible way. With tools designed to support market scanning, signal review, risk management, and one-click trade execution, OCT24 can help traders make faster decisions without ignoring discipline.
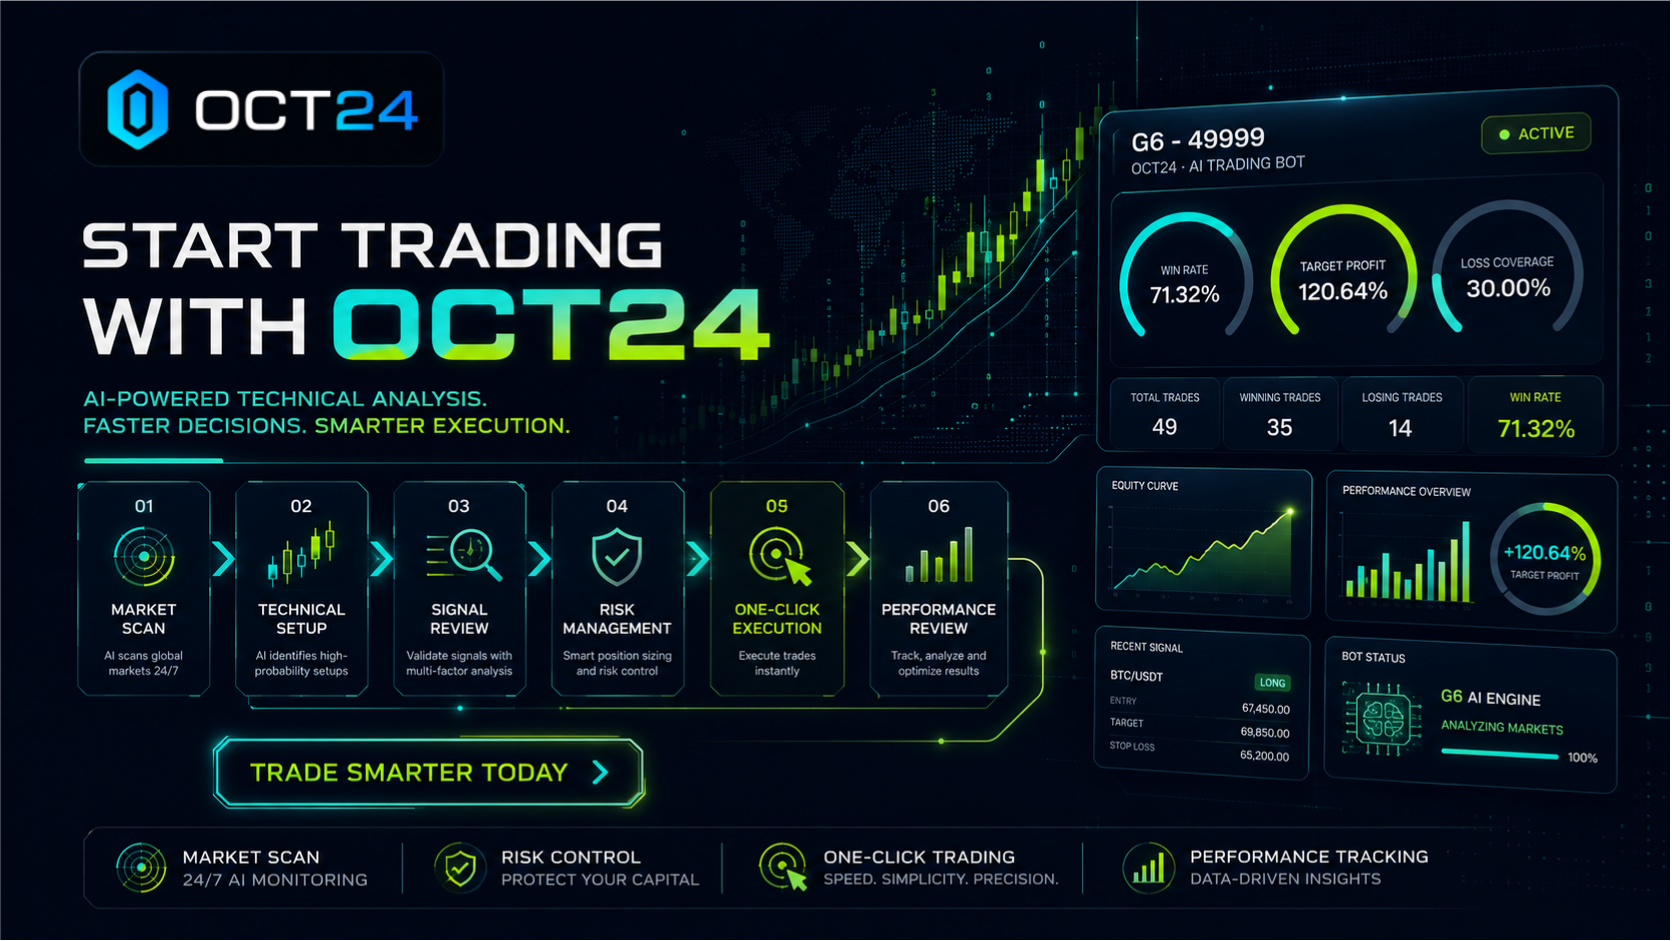
If you are ready to use AI with more structure, insight, and control, Start Trading with OCT24 and build a smarter approach to technical analysis.