
How to Read Crypto Charts
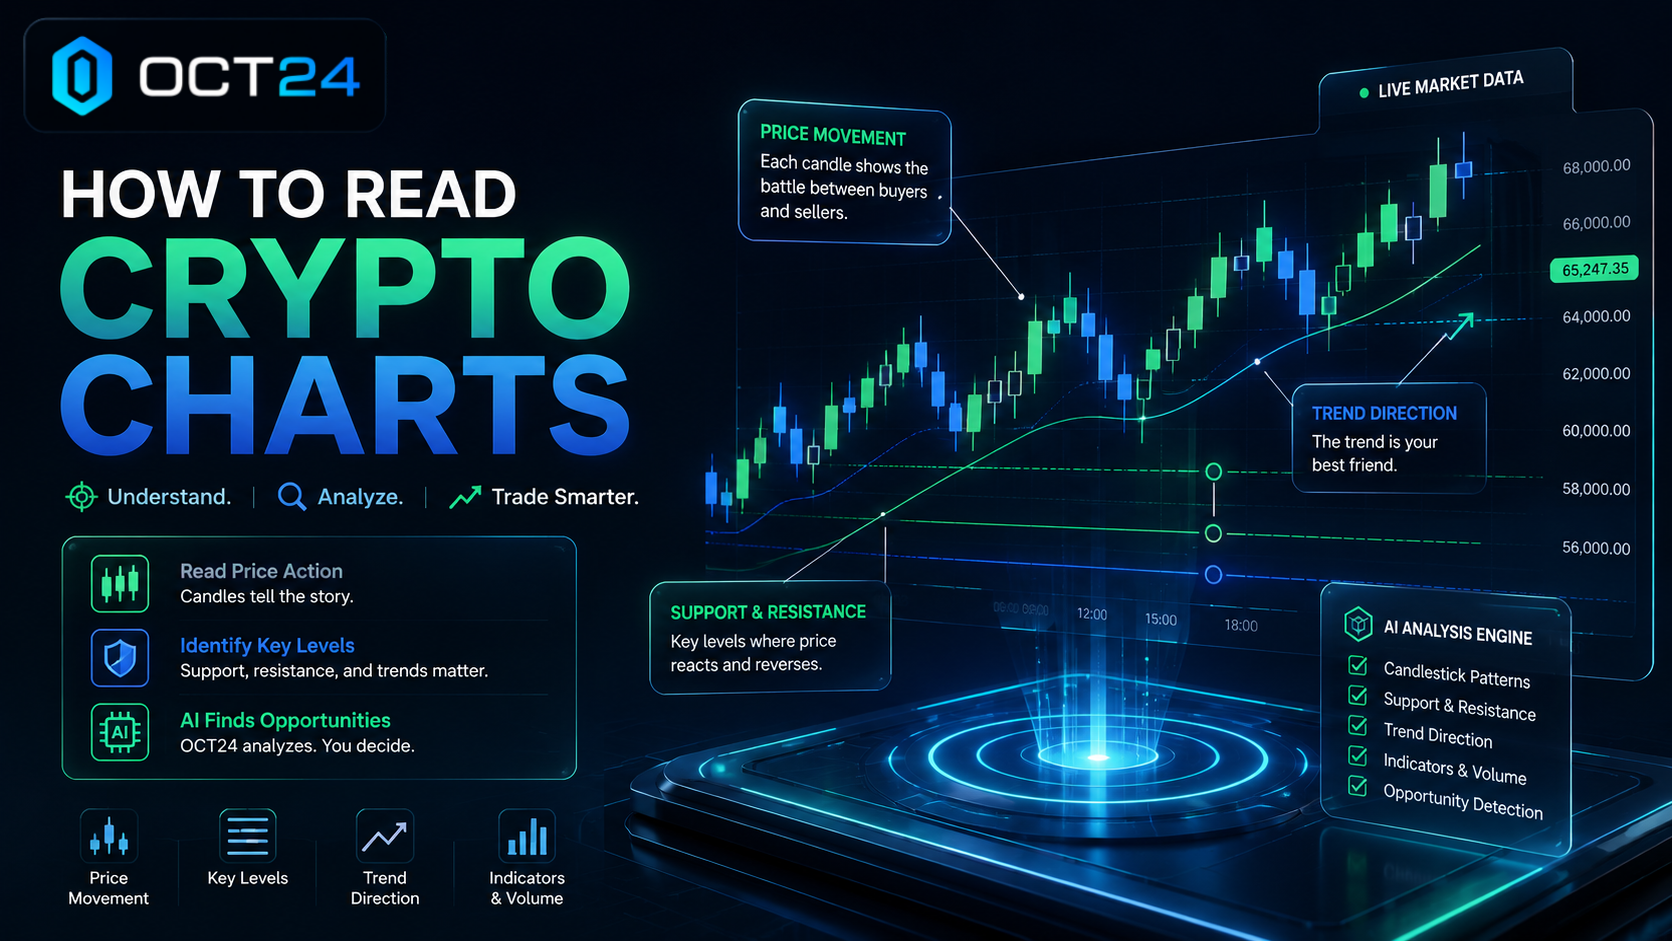
Learning How to Read Crypto Charts is one of the most valuable skills for any trader. Crypto charts transform thousands of individual trades into a visual story of how prices move over time, helping traders recognize trends, identify potential opportunities, and make more informed decisions. Even if you rely on AI-powered trading tools, understanding the basics of chart reading allows you to interpret market activity with greater confidence.
Think of a crypto chart like a weather forecast. A forecast cannot guarantee tomorrow's weather, but it helps you prepare based on the available information. Similarly, crypto charts cannot predict the future with certainty, but they reveal patterns and market behavior that traders use to make informed decisions.
Modern platforms like OCT24 make this process much easier. Rather than requiring users to watch charts throughout the day, the platform continuously analyzes market data, identifies meaningful patterns, and presents potential trading opportunities in a clear, structured format. Understanding the basics of chart reading helps you appreciate why those opportunities are being highlighted.
The Main Types of Crypto Charts
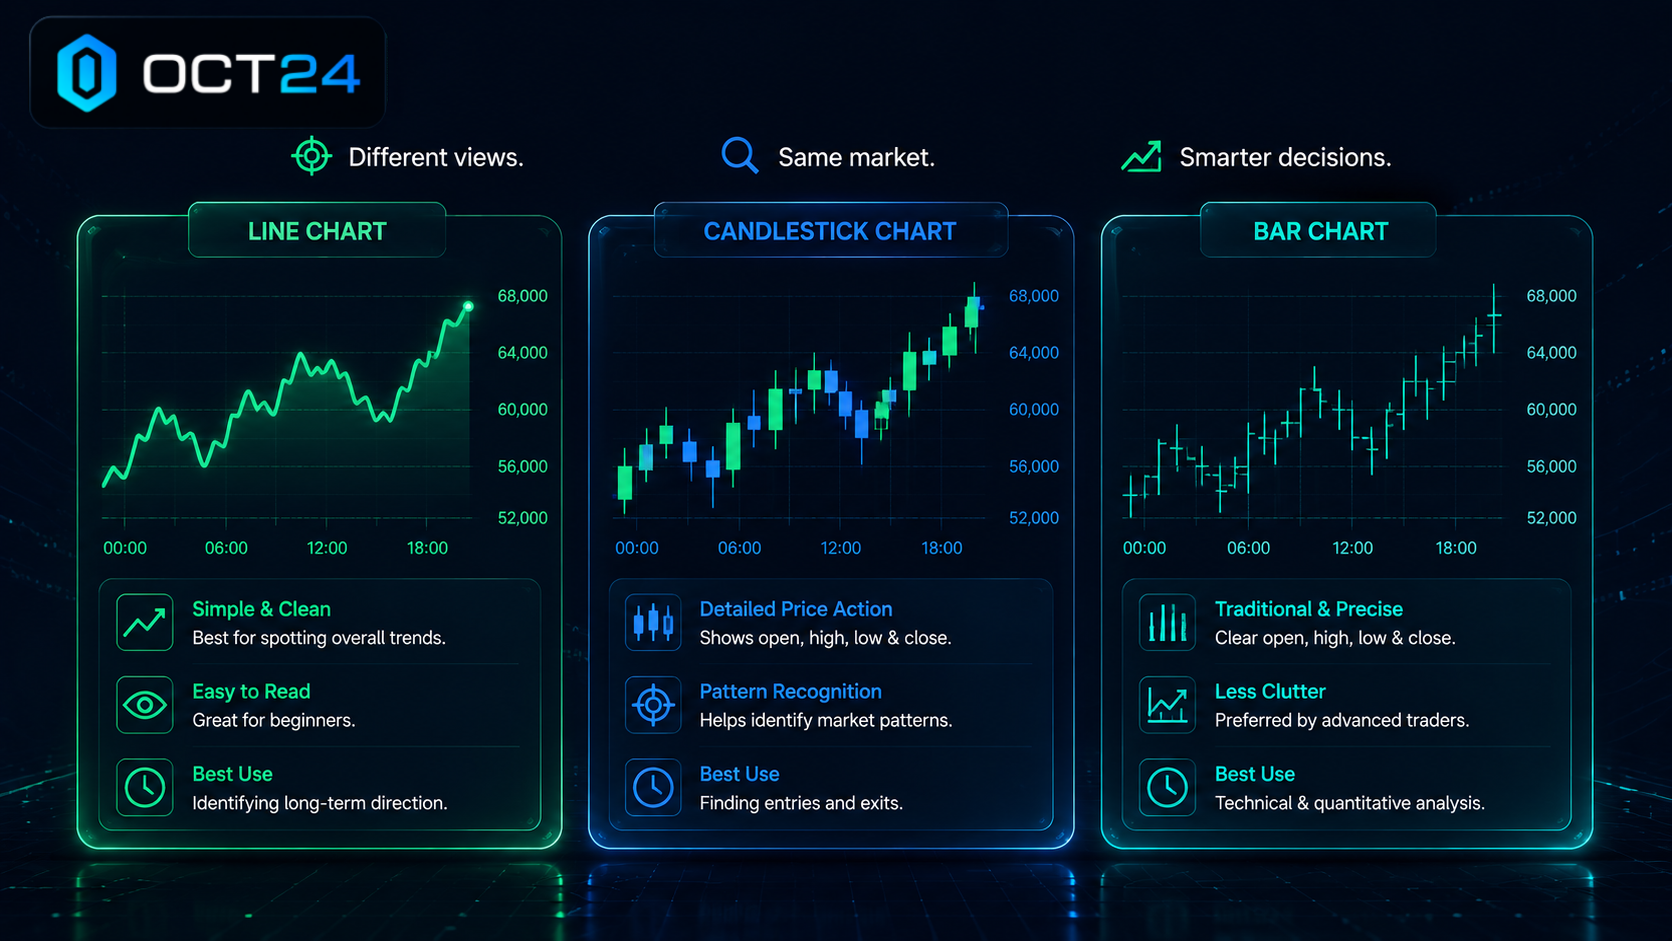
Before learning to interpret market movements, it's helpful to understand the different types of cryptocurrency charts you may encounter.
Although several chart styles exist, most traders rely on three primary formats.
Line Charts
A line chart is the simplest type of crypto chart.
It connects each closing price with a continuous line, making it easy to see whether prices are generally moving higher, lower, or sideways over time.
Line charts are useful for identifying overall trends but provide limited detail about what happened during each trading period.
They are often used by beginners because they are clean and easy to read.
Bar Charts
Bar charts provide more information than line charts.
Each vertical bar displays:
- Opening price
- Highest price
- Lowest price
- Closing price
Although bar charts contain useful information, many traders find them less intuitive than candlestick charts because the price information is presented in a less visual format.
Candlestick Charts
Candlestick charts are by far the most popular choice among cryptocurrency traders.
Each candlestick summarizes how price moved during a specific period while making bullish and bearish price action much easier to recognize at a glance.
For this reason, most professional traders—and platforms like OCT24—primarily analyze candlestick data alongside other market information when evaluating potential trading opportunities.
Whether using AI Trading Software or performing manual analysis, candlestick charts remain one of the most valuable tools for understanding market behavior.
Understanding Candlesticks
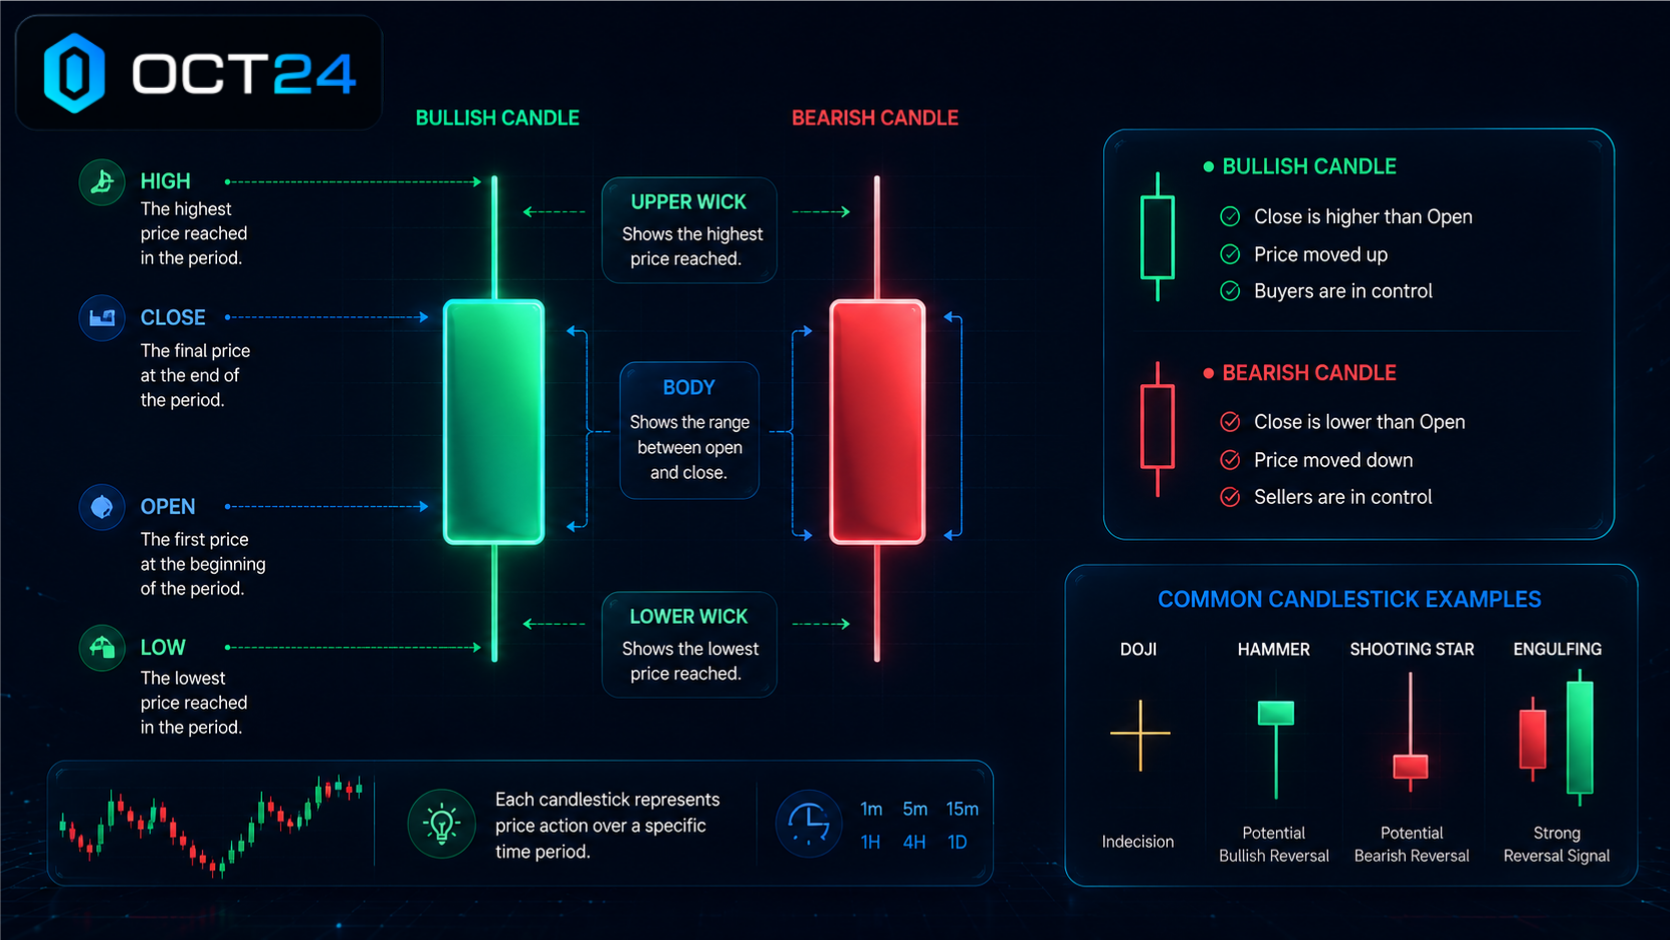
A single candlestick contains four important pieces of information.
These are commonly known as the:
- Open
- High
- Low
- Close
Together, they tell the complete story of price movement during one selected timeframe.
Imagine a one-hour candlestick.
- Open: The price at the beginning of the hour.
- High: The highest price reached during that hour.
- Low: The lowest price reached.
- Close: The final price when the hour ends.
The rectangular portion of the candle is called the body, while the thin lines above and below are known as wicks or shadows.
The body shows where price opened and closed.
The wicks reveal how far price moved before settling at its closing level.
Bullish Candles
A bullish candle forms when the closing price is higher than the opening price.
This suggests buyers were stronger than sellers during that period.
Bullish candles often indicate upward momentum, although they should always be interpreted within the broader market context.
Bearish Candles
A bearish candle forms when the closing price finishes below the opening price.
This indicates sellers controlled the market during that trading period.
Like bullish candles, a single bearish candle does not automatically signal a future trend reversal.
It represents only one piece of the overall market picture.
Quick Tip: One candlestick represents a complete story of price movement during a selected period. Looking at multiple candlesticks together provides far more insight than focusing on just one.
Rather than analyzing a handful of candles, OCT24's AI continuously evaluates thousands of candlesticks across multiple markets and timeframes. It combines this information with additional technical signals to identify higher-quality opportunities while leaving the final trading decision to the user.
Support and Resistance
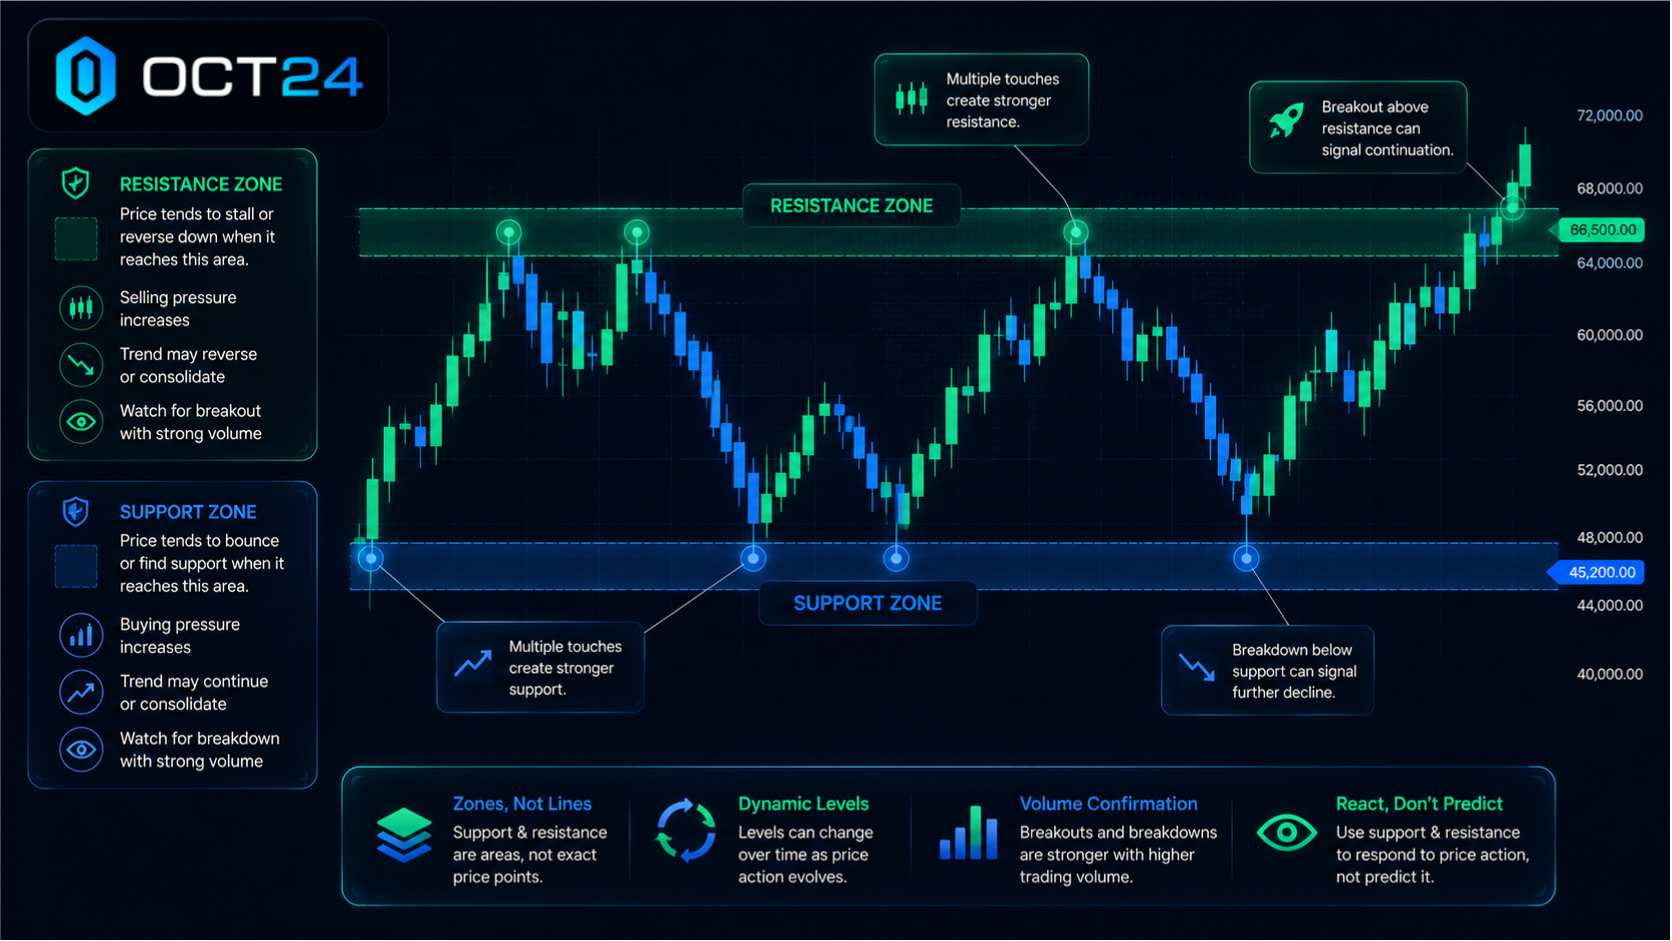
As you continue learning How to Read Crypto Charts, two of the most important concepts to understand are support and resistance.
These levels help traders identify areas where prices have historically struggled to move beyond.
What Is Support?
Support is a price level where buying interest has repeatedly been strong enough to slow or temporarily stop a decline.
When prices approach support, buyers often become more active because they believe the asset offers value at that level.
Although support does not guarantee prices will rise, it frequently acts as an important reference point for traders.
What Is Resistance?
Resistance is the opposite.
It is a price level where selling pressure has historically prevented prices from moving significantly higher.
As prices approach resistance, some traders choose to take profits or reduce exposure, creating additional selling activity.
Again, resistance is not a permanent ceiling, but it often influences market behavior.
A Simple Analogy
Imagine bouncing a ball inside a room.
The floor acts like support because it prevents the ball from falling farther.
The ceiling acts like resistance because it limits how high the ball can travel.
Markets behave in a similar way. Prices frequently react around these important levels before eventually breaking through or reversing direction.
OCT24 incorporates support and resistance analysis into its market evaluation process. Instead of relying on a single price level, the platform considers these zones alongside trend direction, momentum, and other technical factors before highlighting potential trading opportunities.
As explained in How AI Identifies Trading Opportunities, combining multiple forms of market analysis generally provides a stronger foundation for evaluating potential trades than relying on a single indicator alone.
Trend Direction
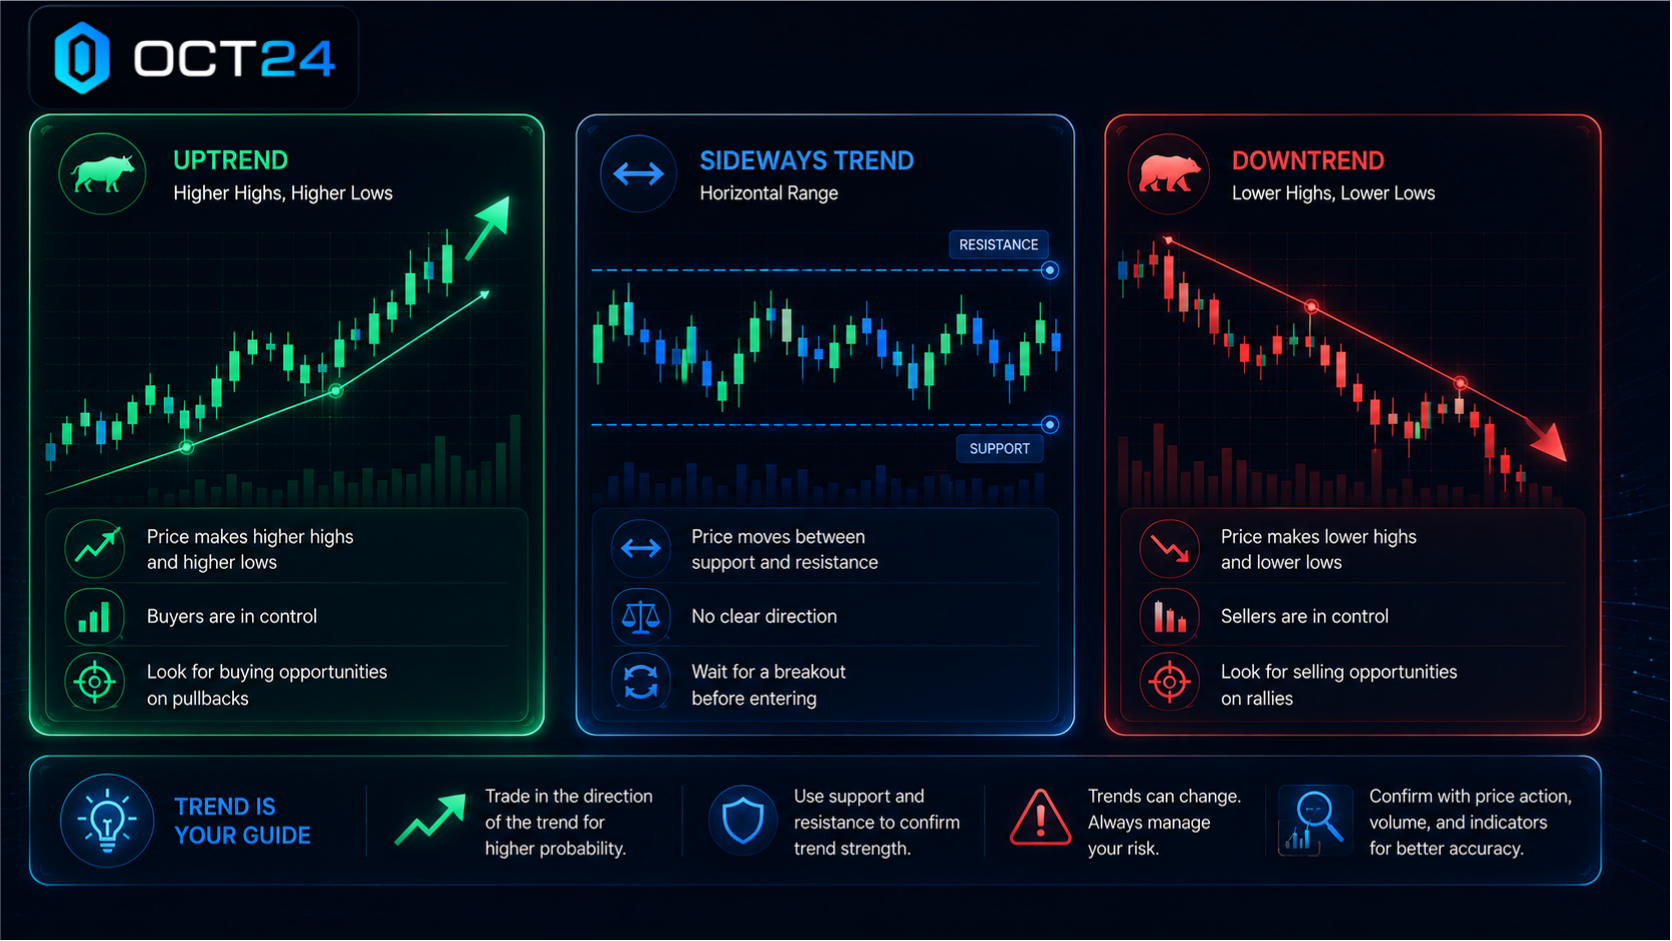
One of the biggest mistakes beginners make is focusing on individual candlesticks instead of the overall market trend.
A single candle represents only one moment in time.
The broader trend provides much more meaningful context.
There are three primary market trends.
Uptrend
An uptrend occurs when prices generally move higher over time.
The market forms a series of higher highs and higher lows, suggesting buyers remain in control.
Downtrend
A downtrend develops when prices consistently move lower.
Lower highs and lower lows indicate that sellers have greater influence over the market.
Sideways Market
Sometimes prices move within a relatively narrow range without establishing a clear upward or downward direction.
This is known as a sideways or ranging market.
During these periods, traders often wait for stronger confirmation before making decisions.
Recognizing the overall trend helps traders avoid placing too much importance on short-term market fluctuations.
OCT24 continuously evaluates both short-term and long-term trends before presenting trading opportunities. By combining trend analysis with pattern recognition and Algorithmic Trading logic, the platform provides additional context that can help traders better understand why specific opportunities are identified.
Understanding trend direction also reinforces many of the Benefits of AI Trading, as AI can monitor multiple timeframes simultaneously while assisting traders in interpreting increasingly complex market conditions.
Likewise, understanding these chart concepts makes it easier to appreciate the distinctions discussed in AI vs Algorithmic Trading, where AI contributes broader market analysis while algorithmic systems provide structured rule-based execution.
Common Chart Indicators Beginners Should Know
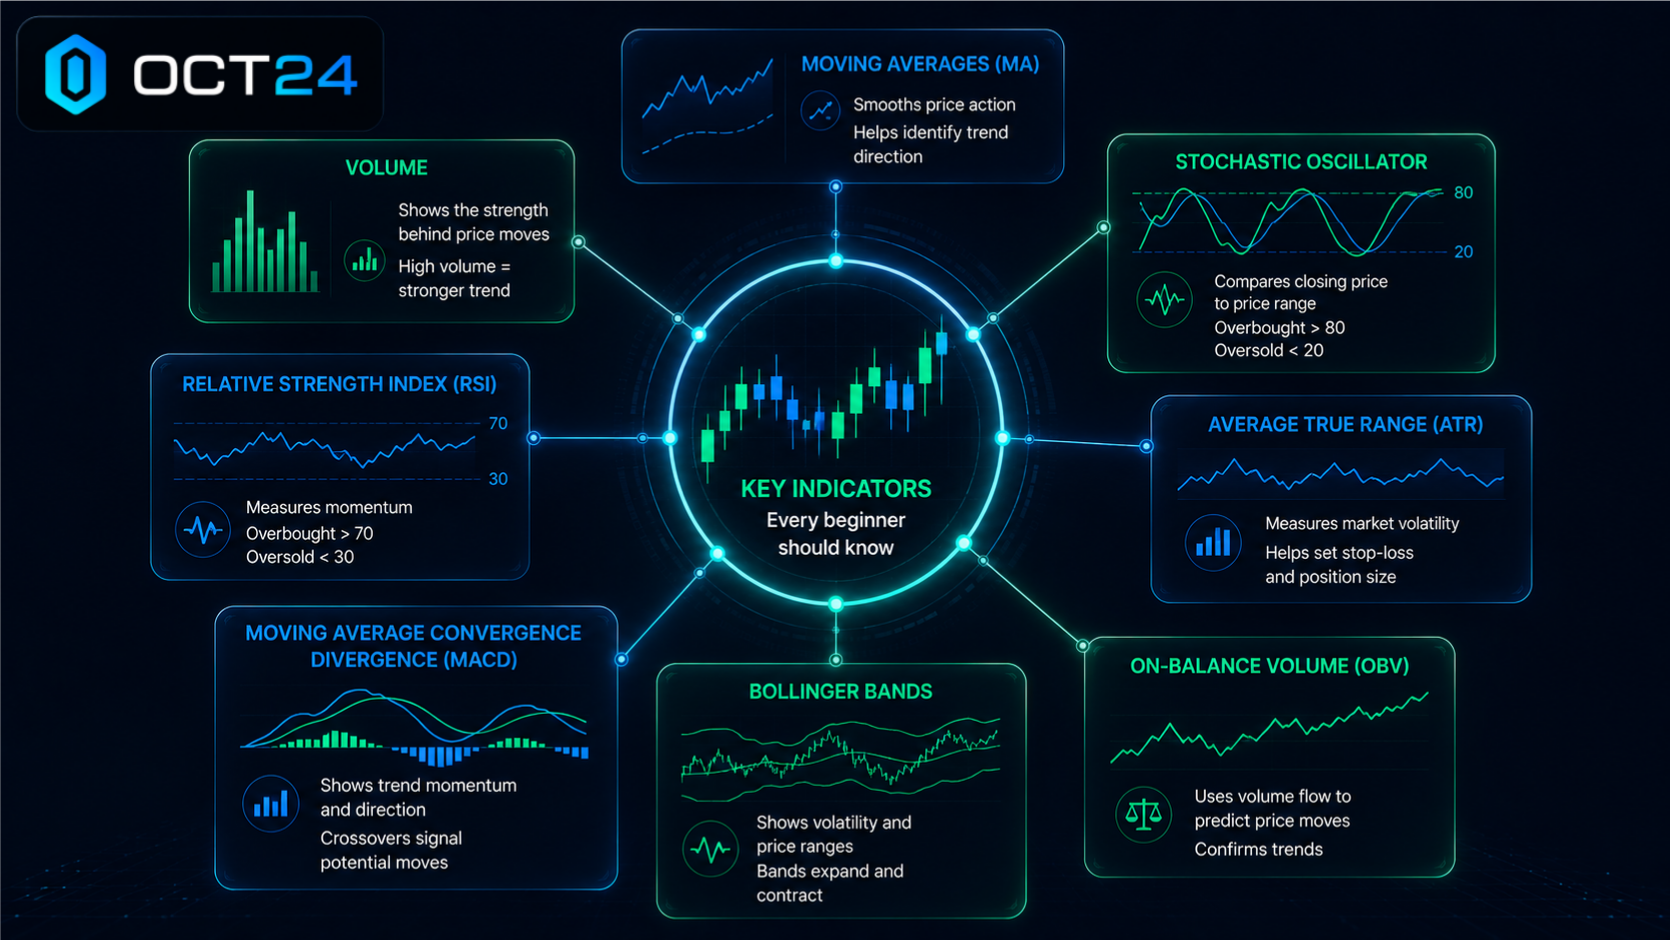
After understanding chart types, candlesticks, and market trends, the next step is becoming familiar with a few common chart indicators. Indicators are mathematical calculations based on price and trading activity that help traders better understand market conditions.
The good news is that beginners do not need to master dozens of indicators. Many modern platforms, including OCT24, automatically evaluate multiple indicators before presenting trading opportunities, allowing users to focus on understanding the bigger picture rather than performing every calculation themselves.
Moving Averages
A moving average smooths out short-term price fluctuations to reveal the overall market direction.
Instead of reacting to every price movement, it calculates the average price over a selected period, making trends easier to identify.
For example:
- A rising moving average often suggests an uptrend.
- A falling moving average may indicate a downtrend.
- A relatively flat moving average can signal a ranging market.
Many traders use moving averages to confirm whether a trend is strengthening or weakening rather than relying on individual candlesticks.
Relative Strength Index (RSI)
The Relative Strength Index, commonly called RSI, measures the speed and strength of recent price movements.
Its primary purpose is to help identify whether an asset may be overbought or oversold.
Generally:
- Higher RSI readings suggest strong buying momentum.
- Lower RSI readings indicate stronger selling pressure.
However, RSI should never be viewed in isolation. It becomes far more useful when combined with trend analysis and other market signals.
MACD
The Moving Average Convergence Divergence (MACD) indicator helps traders evaluate momentum and potential trend changes.
Without becoming overly technical, think of MACD as a way to compare short-term momentum with longer-term momentum.
When both begin moving in the same direction, traders often gain additional confidence that a trend is developing.
Trading Volume
Volume measures how much of a cryptocurrency has been traded during a specific period.
Price movements supported by strong trading volume generally carry more significance than movements occurring on very low volume.
For example, a price breakout accompanied by unusually high volume may indicate stronger market participation than a breakout occurring with very little trading activity.
Rather than requiring traders to manually evaluate every indicator, OCT24 continuously analyzes moving averages, RSI, MACD, trading volume, candlestick patterns, and other technical signals together. This helps users understand why a potential trading opportunity has been identified without needing to monitor every indicator individually.
Timeframes Matter
One chart can tell one story.
Multiple timeframes tell a much more complete story.
Every candlestick chart is built using a specific timeframe, and each timeframe reveals different market behavior.
Common chart timeframes include:
- 1-minute: Extremely short-term price movements that change rapidly.
- 15-minute: Often used by active traders looking for intraday opportunities.
- 1-hour: A balanced view that filters some short-term market noise.
- 4-hour: Useful for identifying broader trends while still capturing meaningful price movements.
- Daily: Shows the long-term direction of the market and is commonly used for higher-level trend analysis.
A cryptocurrency might appear to be rising on a 15-minute chart while still moving within a broader downtrend on the daily chart.
This is why experienced traders rarely rely on only one timeframe before making a decision.
OCT24 analyzes multiple chart timeframes to help identify trading opportunities across different market conditions. Each trading bot is designed around a specific strategy and timeframe. For example, the G6 Trading Bot specializes in the 1-minute timeframe, continuously evaluating every new candlestick to identify short-term opportunities, while future bots will focus on additional timeframes to suit different trading styles.
Common Beginner Mistakes When Reading Charts
Learning to read crypto charts takes practice, and nearly every beginner encounters similar challenges.
Recognizing these mistakes early can help traders build stronger habits and make more informed decisions.
Focusing on Individual Candles
One candlestick rarely tells the whole story.
For example, seeing one large green candle does not necessarily mean a strong uptrend has begun. Looking at several candles together provides much more reliable context.
Ignoring the Overall Trend
A temporary price increase inside a larger downtrend does not automatically signal that the market has reversed.
Always begin by identifying the broader market direction before evaluating individual trading opportunities.
Chasing Sudden Price Moves
Large price spikes often attract attention because they create fear of missing out.
However, entering a trade simply because the market has moved quickly can increase risk if the underlying trend or supporting indicators do not confirm the move.
Ignoring Trading Volume
Price movements without meaningful trading volume may lack strong market participation.
Checking volume alongside price action helps traders better understand the strength behind a move.
Overcomplicating Chart Analysis
Many beginners believe they need dozens of indicators covering every chart.
In reality, adding too many indicators often creates confusion instead of clarity.
A smaller number of well-understood indicators usually provides more useful information.
This is one reason AI-assisted analysis has become increasingly popular. Platforms like OCT24 automatically evaluate multiple market conditions, helping reduce common analytical mistakes while ensuring traders remain responsible for reviewing each opportunity and making the final decision.
For traders interested in developing systematic approaches, our guide to AI Trading Strategies explores how structured trading plans can complement chart analysis, while AI Trading Bots demonstrate how technology can automate repetitive market monitoring.
How OCT24 Simplifies Crypto Chart Analysis
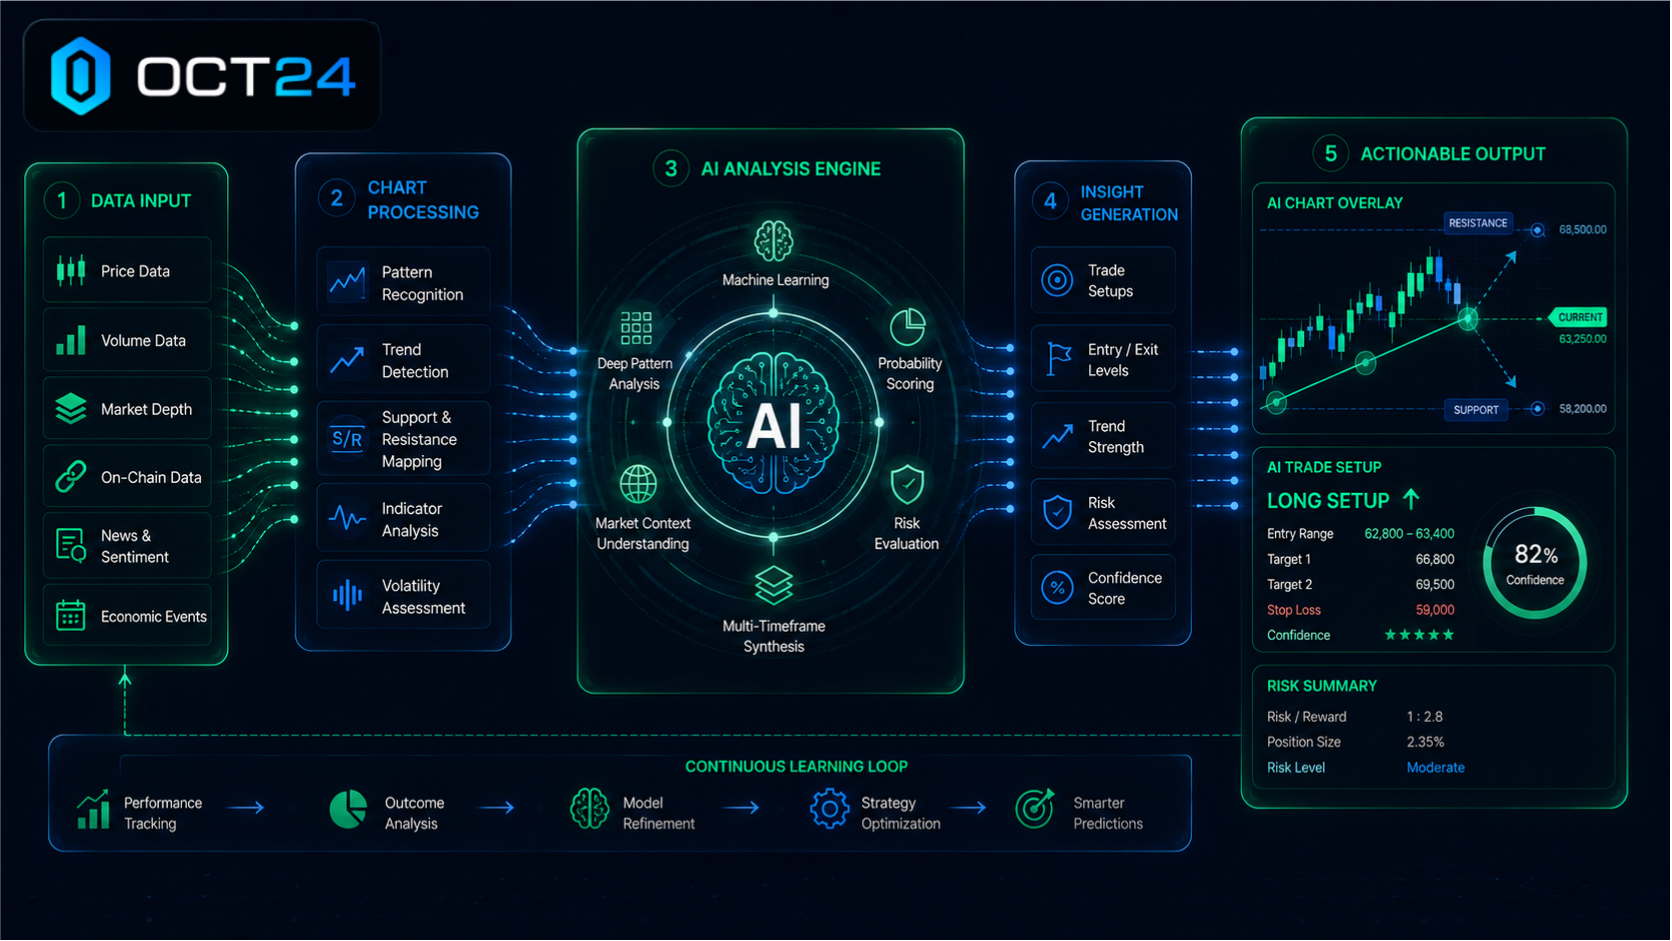
Reading charts is an essential trading skill, but manually monitoring markets around the clock can quickly become overwhelming.
OCT24 was designed to reduce that workload while keeping traders fully involved in the decision-making process.
At the center of the platform is the G6 Trading Bot, which continuously analyzes cryptocurrency markets using artificial intelligence and algorithmic decision logic.
Rather than focusing on a single indicator, the platform continuously:
- Analyzes candlestick patterns
- Detects support and resistance zones
- Monitors short-term and long-term trends
- Evaluates multiple technical indicators
- Compares several chart timeframes
- Ranks potential trading opportunities
- Prepares structured trade setups
- Supports one-click trade execution
This means users are not required to:
- Watch charts throughout the day
- Memorize dozens of technical indicators
- Analyze every candlestick manually
- Build complex trading systems
Instead, OCT24 performs the technical analysis in the background and presents reviewed trading opportunities in a clear, easy-to-understand format. Traders remain in control by deciding whether each opportunity aligns with their own objectives and risk tolerance before executing a trade.
Risk management remains equally important. Resources such as Trading Bot Risk Management, Position Sizing Controls, and Portfolio Diversification Tools can help traders develop disciplined habits alongside technical analysis.
If you would like to learn more about the company's technology and mission, visit About OCT24.
Frequently Asked Questions
How do beginners read crypto charts?
Start by learning the basics of chart types, candlesticks, trends, support and resistance, and a few common indicators. Focus on understanding the overall market picture rather than every short-term price movement.
What is a candlestick chart?
A candlestick chart displays the opening, closing, highest, and lowest prices during a selected timeframe, making it one of the most popular chart formats for cryptocurrency trading.
What is support and resistance?
Support is a price level where buying interest has historically slowed declines, while resistance is a level where selling pressure has often limited further price increases.
Which timeframe should I use?
It depends on your trading style. Shorter timeframes show more detailed price movements, while longer timeframes provide a broader market perspective. OCT24 continuously analyzes new market data to identify short-term trading opportunities.
Do I need to learn every indicator?
No.
Understanding a few core indicators is usually sufficient for beginners. Many modern trading platforms analyze numerous indicators automatically before presenting trading opportunities.
Can AI read crypto charts?
Yes.
AI can rapidly evaluate candlestick patterns, technical indicators, trading volume, market trends, and multiple timeframes to help identify potential trading opportunities.
Does OCT24 analyze charts automatically?
Yes.
OCT24 continuously analyzes cryptocurrency markets in the background, evaluating multiple technical factors before presenting structured opportunities for user review and one-click execution.
How do I get started?
Begin by learning the basics of chart reading and risk management, then practice interpreting market conditions consistently. When you're ready to apply these concepts using AI-assisted analysis, you can Start Trading with OCT24.
Final Summary
Learning how to read crypto charts does not require becoming a professional technical analyst overnight.
By understanding the main chart types, interpreting candlesticks, recognizing support and resistance, identifying trends, becoming familiar with a handful of indicators, and appreciating how different timeframes interact, you can develop a much stronger understanding of market behavior.
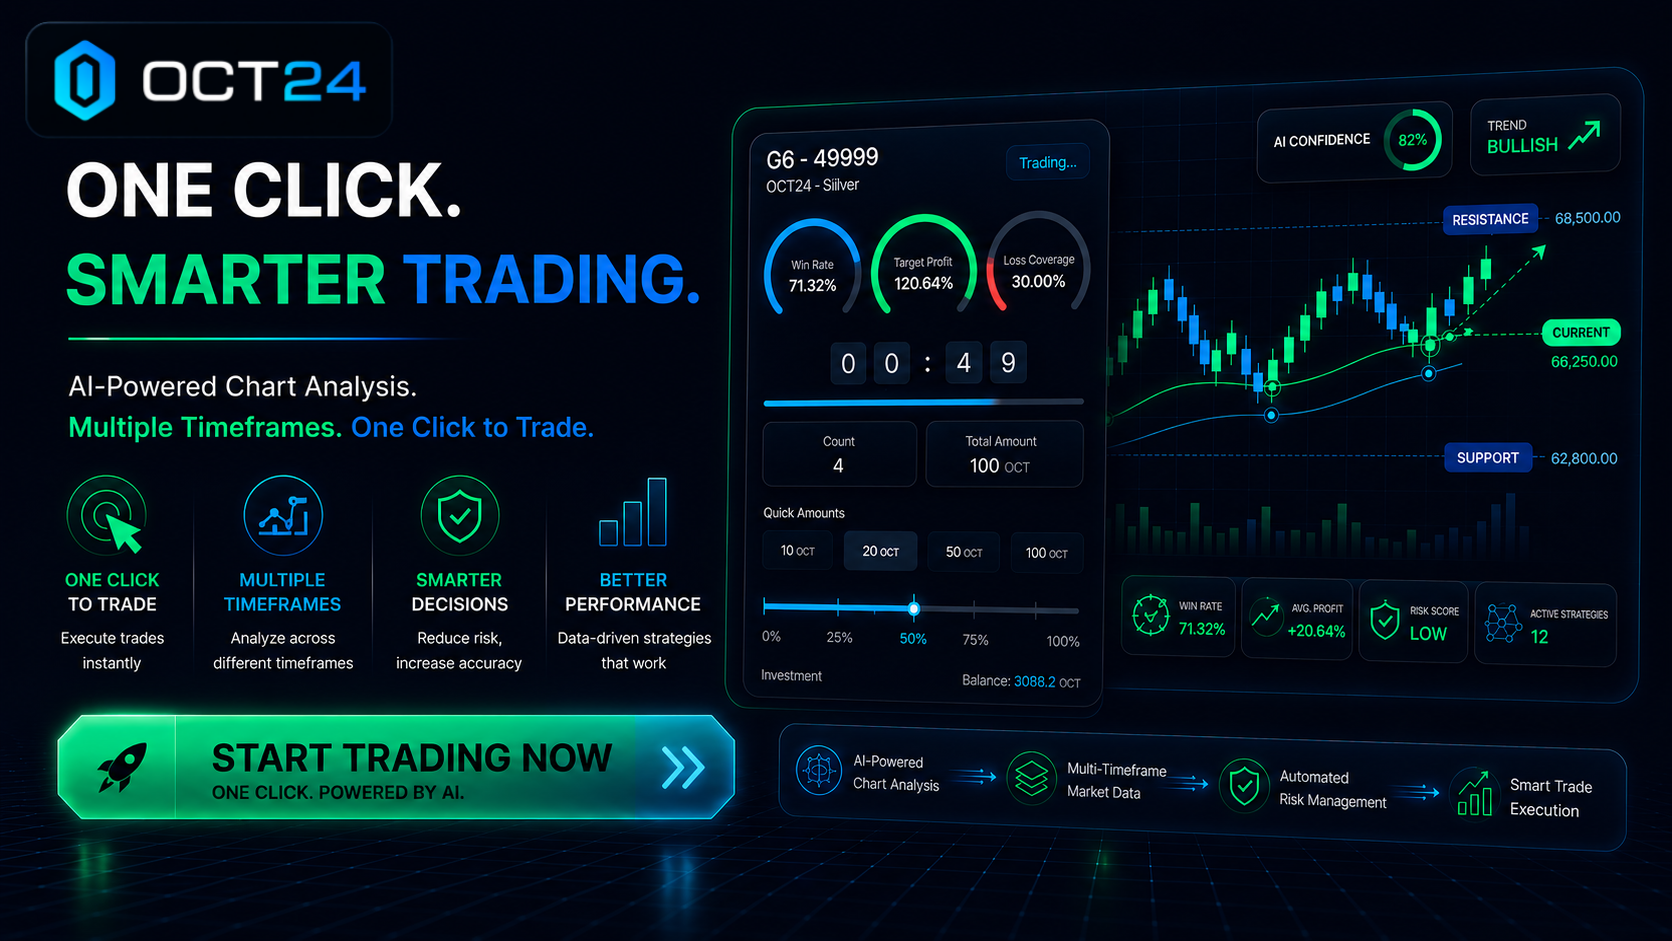
These skills also make it easier to interpret the AI-generated opportunities presented by OCT24. Instead of replacing your judgment, the platform continuously analyzes markets, evaluates technical conditions, and presents structured trading opportunities that you can review with greater confidence.
Combining a solid understanding of chart reading with disciplined risk management and AI-powered market analysis can help you make more informed trading decisions while remaining fully in control of every trade.